Regional Land Transport Programme 2009 - 2010 (2MB) - Auckland ...
Regional Land Transport Programme 2009 - 2010 (2MB) - Auckland ...
Regional Land Transport Programme 2009 - 2010 (2MB) - Auckland ...

Create successful ePaper yourself
Turn your PDF publications into a flip-book with our unique Google optimized e-Paper software.
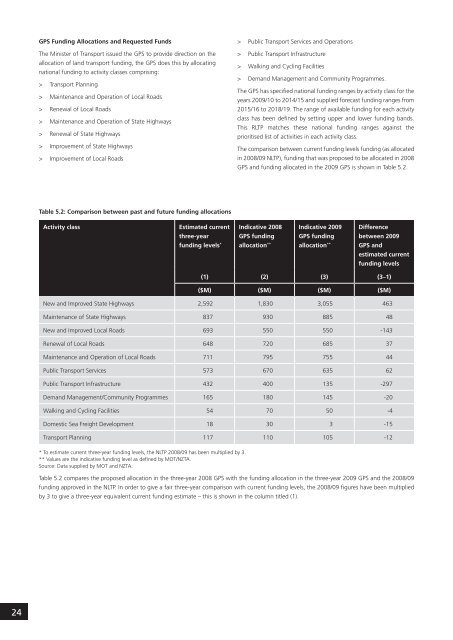
GPS Funding Allocations and Requested Funds<br />
><br />
Public <strong>Transport</strong> Services and Operations<br />
The Minister of <strong>Transport</strong> issued the GPS to provide direction on the<br />
allocation of land transport funding, the GPS does this by allocating<br />
national funding to activity classes comprising:<br />
> <strong>Transport</strong> Planning<br />
> Maintenance and Operation of Local Roads<br />
> Renewal of Local Roads<br />
> Maintenance and Operation of State Highways<br />
> Renewal of State Highways<br />
> Improvement of State Highways<br />
> Improvement of Local Roads<br />
> Public <strong>Transport</strong> Infrastructure<br />
> Walking and Cycling Facilities<br />
> Demand Management and Community <strong>Programme</strong>s.<br />
The GPS has specified national funding ranges by activity class for the<br />
years <strong>2009</strong>/10 to 2014/15 and supplied forecast funding ranges from<br />
2015/16 to 2018/19. The range of available funding for each activity<br />
class has been defined by setting upper and lower funding bands.<br />
This RLTP matches these national funding ranges against the<br />
prioritised list of activities in each activity class.<br />
The comparison between current funding levels funding (as allocated<br />
in 2008/09 NLTP), funding that was proposed to be allocated in 2008<br />
GPS and funding allocated in the <strong>2009</strong> GPS is shown in Table 5.2.<br />
Table 5.2: Comparison between past and future funding allocations<br />
Activity class<br />
Estimated current Indicative 2008 Indicative <strong>2009</strong><br />
funding levels * allocation ** allocation **<br />
three-year GPS funding GPS funding<br />
Difference<br />
between <strong>2009</strong><br />
GPS and<br />
estimated current<br />
funding levels<br />
(1) (2) (3) (3–1)<br />
($M) ($M) ($M) ($M)<br />
New and Improved State Highways 2,592 1,830 3,055 463<br />
Maintenance of State Highways 837 930 885 48<br />
New and Improved Local Roads 693 550 550 -143<br />
Renewal of Local Roads 648 720 685 37<br />
Maintenance and Operation of Local Roads 711 795 755 44<br />
Public <strong>Transport</strong> Services 573 670 635 62<br />
Public <strong>Transport</strong> Infrastructure 432 400 135 -297<br />
Demand Management/Community <strong>Programme</strong>s 165 180 145 -20<br />
Walking and Cycling Facilities 54 70 50 -4<br />
Domestic Sea Freight Development 18 30 3 -15<br />
<strong>Transport</strong> Planning 117 110 105 -12<br />
* To estimate current three-year funding levels, the NLTP 2008/09 has been multiplied by 3.<br />
** Values are the indicative funding level as defined by MOT/NZTA.<br />
Source: Data supplied by MOT and NZTA.<br />
Table 5.2 compares the proposed allocation in the three-year 2008 GPS with the funding allocation in the three-year <strong>2009</strong> GPS and the 2008/09<br />
funding approved in the NLTP. In order to give a fair three-year comparison with current funding levels, the 2008/09 figures have been multiplied<br />
by 3 to give a three-year equivalent current funding estimate – this is shown in the column titled (1).<br />
24