Regional Land Transport Programme 2009 - 2010 (2MB) - Auckland ...
Regional Land Transport Programme 2009 - 2010 (2MB) - Auckland ...
Regional Land Transport Programme 2009 - 2010 (2MB) - Auckland ...

You also want an ePaper? Increase the reach of your titles
YUMPU automatically turns print PDFs into web optimized ePapers that Google loves.
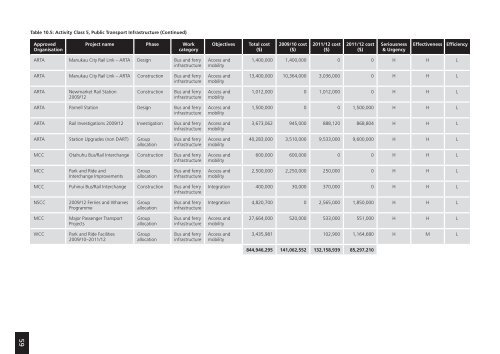
Table 10.5: Activity Class 5, Public <strong>Transport</strong> Infrastructure (Continued)<br />
Approved<br />
Organisation<br />
Project name Phase Work<br />
category<br />
Objectives<br />
Total cost<br />
($)<br />
<strong>2009</strong>/10 cost<br />
($)<br />
2011/12 cost<br />
($)<br />
2011/12 cost<br />
($)<br />
Seriousness<br />
& Urgency<br />
Effectiveness<br />
Efficiency<br />
ARTA Manukau City Rail Link – ARTA Design Bus and ferry<br />
infrastructure<br />
ARTA Manukau City Rail Link – ARTA Construction Bus and ferry<br />
infrastructure<br />
Access and<br />
mobility<br />
Access and<br />
mobility<br />
1,400,000 1,400,000 0 0 H H L<br />
13,400,000 10,364,000 3,036,000 0 H H L<br />
ARTA<br />
Newmarket Rail Station<br />
<strong>2009</strong>/12<br />
Construction<br />
Bus and ferry<br />
infrastructure<br />
Access and<br />
mobility<br />
1,012,000 0 1,012,000 0 H H L<br />
ARTA Parnell Station Design Bus and ferry<br />
infrastructure<br />
ARTA Rail Investigations <strong>2009</strong>/12 Investigation Bus and ferry<br />
infrastructure<br />
Access and<br />
mobility<br />
Access and<br />
mobility<br />
1,500,000 0 0 1,500,000 H H L<br />
3,673,062 945,000 888,120 868,804 H H L<br />
ARTA Station Upgrades (non DART) Group<br />
allocation<br />
Bus and ferry<br />
infrastructure<br />
Access and<br />
mobility<br />
40,283,000 3,510,000 9,533,000 9,600,000 H H L<br />
MCC Otahuhu Bus/Rail Interchange Construction Bus and ferry<br />
infrastructure<br />
Access and<br />
mobility<br />
600,000 600,000 0 0 H H L<br />
MCC<br />
Park and Ride and<br />
Interchange Improvements<br />
Group<br />
allocation<br />
Bus and ferry<br />
infrastructure<br />
Access and<br />
mobility<br />
2,500,000 2,250,000 250,000 0 H H L<br />
MCC Puhinui Bus/Rail Interchange Construction Bus and ferry<br />
infrastructure<br />
Integration 400,000 30,000 370,000 0 H H L<br />
NSCC<br />
<strong>2009</strong>/12 Ferries and Wharves<br />
<strong>Programme</strong><br />
Group<br />
allocation<br />
Bus and ferry<br />
infrastructure<br />
Integration 4,820,700 0 2,565,000 1,850,000 H H L<br />
MCC<br />
Major Passenger <strong>Transport</strong><br />
Projects<br />
Group<br />
allocation<br />
Bus and ferry<br />
infrastructure<br />
Access and<br />
mobility<br />
27,664,000 520,000 533,000 551,000 H H L<br />
WCC<br />
Park and Ride Facilities<br />
<strong>2009</strong>/10–2011/12<br />
Group<br />
allocation<br />
Bus and ferry<br />
infrastructure<br />
Access and<br />
mobility<br />
3,435,981 102,900 1,164,680 H M L<br />
844,946,295 141,062,552 132,158,939 85,297,210<br />
59