Regional Land Transport Programme 2009 - 2010 (2MB) - Auckland ...
Regional Land Transport Programme 2009 - 2010 (2MB) - Auckland ...
Regional Land Transport Programme 2009 - 2010 (2MB) - Auckland ...

Create successful ePaper yourself
Turn your PDF publications into a flip-book with our unique Google optimized e-Paper software.
The proportion of funding proposed to be spent on TDM has<br />
increased over previous LTPs, however, remains below the RLTS<br />
percentage target. It appears that the funding requested on<br />
TDM has been increased by a large NZTA State highways<br />
programme on walking and cycling schemes, and this has<br />
masked to some degree a large cutback in funding requests from<br />
the local authorities.<br />
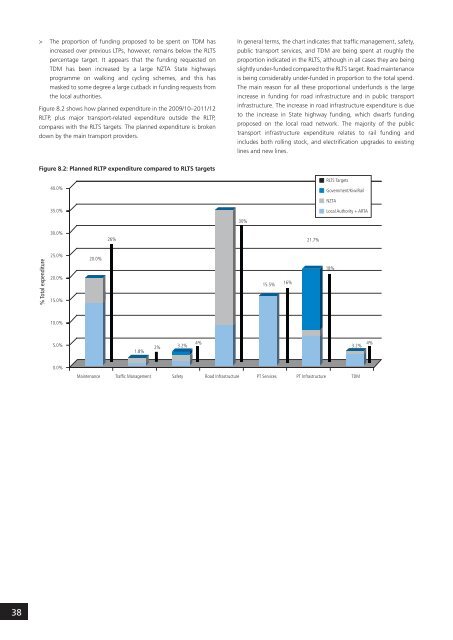
In general terms, the chart indicates that traffic management, safety,<br />
public transport services, and TDM are being spent at roughly the<br />
proportion indicated in the RLTS, although in all cases they are being<br />
slightly under-funded compared to the RLTS target. Road maintenance<br />
is being considerably under-funded in proportion to the total spend.<br />
The main reason for all these proportional underfunds is the large<br />
increase in funding for road infrastructure and in public transport<br />
Figure 8.2 shows how planned expenditure in the <strong>2009</strong>/10–2011/12<br />
RLTP, plus major transport-related expenditure outside the RLTP,<br />
compares with the RLTS targets. The planned expenditure is broken<br />
down by the main transport providers.<br />
infrastructure. The increase in road infrastructure expenditure is due<br />
to the increase in State highway funding, which dwarfs funding<br />
proposed on the local road network. The majority of the public<br />
transport infrastructure expenditure relates to rail funding and<br />
includes both rolling stock, and electrification upgrades to existing<br />
lines and new lines.<br />
Figure 8.2: Planned RLTP expenditure compared to RLTS targets<br />
40.0%<br />
RLTS Targets<br />
Government/KiwiRail<br />
NZTA<br />
35.0%<br />
Local Authority + ARTA<br />
30%<br />
30.0%<br />
26%<br />
34.7%<br />
21.7%<br />
% Total expenditure<br />
25.0%<br />
20.0%<br />
15.0%<br />
20.0%<br />
15.5%<br />
16%<br />
18%<br />
10.0%<br />
5.0%<br />
1.8%<br />
2%<br />
3.2%<br />
4%<br />
3.2% 4%<br />
0.0%<br />
Maintenance Traffic Management Safety Road Infrastructure<br />
PT Services PT Infrastructure TDM<br />
38