Regional Land Transport Programme 2009 - 2010 (2MB) - Auckland ...
Regional Land Transport Programme 2009 - 2010 (2MB) - Auckland ...
Regional Land Transport Programme 2009 - 2010 (2MB) - Auckland ...

You also want an ePaper? Increase the reach of your titles
YUMPU automatically turns print PDFs into web optimized ePapers that Google loves.
8 MONITORING<br />
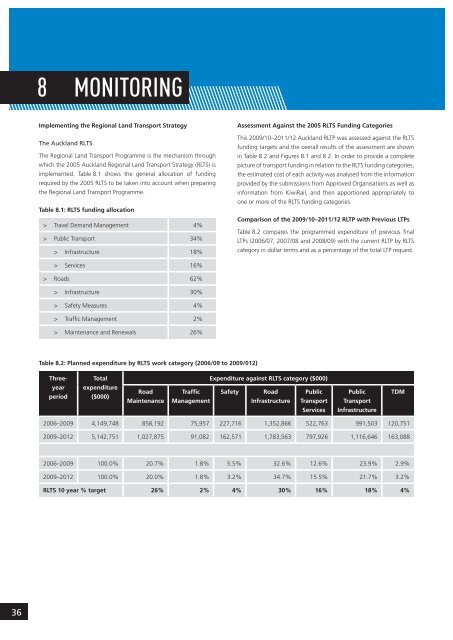
Implementing the <strong>Regional</strong> <strong>Land</strong> <strong>Transport</strong> Strategy<br />
The <strong>Auckland</strong> RLTS<br />
The <strong>Regional</strong> <strong>Land</strong> <strong>Transport</strong> <strong>Programme</strong> is the mechanism through<br />
which the 2005 <strong>Auckland</strong> <strong>Regional</strong> <strong>Land</strong> <strong>Transport</strong> Strategy (RLTS) is<br />
implemented. Table 8.1 shows the general allocation of funding<br />
required by the 2005 RLTS to be taken into account when preparing<br />
the <strong>Regional</strong> <strong>Land</strong> <strong>Transport</strong> <strong>Programme</strong>.<br />
Table 8.1: RLTS funding allocation<br />
> Travel Demand Management<br />
4%<br />
> Public <strong>Transport</strong><br />
34%<br />
> Infrastructure<br />
18%<br />
Assessment Against the 2005 RLTS Funding Categories<br />
This <strong>2009</strong>/10–2011/12 <strong>Auckland</strong> RLTP was assessed against the RLTS<br />
funding targets and the overall results of the assessment are shown<br />
in Table 8.2 and Figures 8.1 and 8.2. In order to provide a complete<br />
picture of transport funding in relation to the RLTS funding categories,<br />
the estimated cost of each activity was analysed from the information<br />
provided by the submissions from Approved Organisations as well as<br />
information from KiwiRail, and then apportioned appropriately to<br />
one or more of the RLTS funding categories.<br />
Comparison of the <strong>2009</strong>/10–2011/12 RLTP with Previous LTPs<br />
Table 8.2 compares the programmed expenditure of previous final<br />
LTPs (2006/07, 2007/08 and 2008/09) with the current RLTP by RLTS<br />
category in dollar terms and as a percentage of the total LTP request.<br />
> Services<br />
16%<br />
> Roads<br />
62%<br />
> Infrastructure<br />
30%<br />
> Safety Measures<br />
4%<br />
> Traffic Management<br />
2%<br />
> Maintenance and Renewals<br />
26%<br />
Table 8.2: Planned expenditure by RLTS work category (2006/09 to <strong>2009</strong>/012)<br />
Threeyear<br />
period<br />
Total<br />
expenditure<br />
($000)<br />
Road<br />
Maintenance<br />
Expenditure against RLTS category ($000)<br />
Traffic Safety Road Public<br />
Management<br />
Infrastructure <strong>Transport</strong><br />
Services<br />
Public<br />
<strong>Transport</strong><br />
Infrastructure<br />
TDM<br />
2006–<strong>2009</strong> 4,149,748 858,192 75,957 227,716 1,352,866 522,763 991,503 120,751<br />
<strong>2009</strong>–2012 5,142,751 1,027,875 91,082 162,571 1,783,563 797,926 1,116,646 163,088<br />
2006–<strong>2009</strong> 100.0% 20.7% 1.8% 5.5% 32.6% 12.6% 23.9% 2.9%<br />
<strong>2009</strong>–2012 100.0% 20.0% 1.8% 3.2% 34.7% 15.5% 21.7% 3.2%<br />
RLTS 10 year % target 26% 2% 4% 30% 16% 18% 4%<br />
36