National TV Toolbox User Guide - Nielsen
National TV Toolbox User Guide - Nielsen
National TV Toolbox User Guide - Nielsen

You also want an ePaper? Increase the reach of your titles
YUMPU automatically turns print PDFs into web optimized ePapers that Google loves.
<strong>National</strong> <strong>TV</strong> <strong>Toolbox</strong> <strong>User</strong><br />
<strong>Guide</strong><br />
Release 5.3
Document: <strong>National</strong> <strong>TV</strong> <strong>Toolbox</strong> <strong>User</strong> <strong>Guide</strong><br />
Document Version: 5.3<br />
Revised: 04/26/2012<br />
Trademark<br />
<strong>Nielsen</strong> and the <strong>Nielsen</strong> logo are trademarks or registered trademarks of CZT/ACN Trademarks, L.L.C.<br />
Galaxy, MarketBreaks, Monitor-Plus, NPOWER, NSI, NSS, and PowerPlay are trademarks or registered<br />
trademarks of The <strong>Nielsen</strong> Company (US), LLC.<br />
Microsoft, Excel, Internet Explorer, and Windows are trademarks or registered trademarks of Microsoft<br />
Corporation in the United States and other countries. Other company names and/or product/service names<br />
are trademarks or registered trademarks of their respective companies.<br />
This documentation contains proprietary information of The <strong>Nielsen</strong> Company. Publication, disclosure,<br />
copying, or distribution of this document or any of its contents is prohibited, unless consent has been<br />
obtained from The <strong>Nielsen</strong> Company.<br />
Disclaimer<br />
Some of the data in this document is for illustrative purposes only and may not contain or reflect the actual<br />
data and/or information provided by <strong>Nielsen</strong> to its clients.<br />
Copyright<br />
Copyright © 2005 - 2012 The <strong>Nielsen</strong> Company. All rights reserved.
Contents<br />
Chapter 1: About <strong>National</strong> <strong>TV</strong> <strong>Toolbox</strong> ..................................7<br />
What's New? ...........................................................................................................8<br />
System Requirements ...........................................................................................12<br />
Setting Screen Resolution ..........................................................................12<br />
Chapter 2: The <strong>National</strong> <strong>TV</strong> <strong>Toolbox</strong> Workspace ................13<br />
The <strong>National</strong> <strong>TV</strong> <strong>Toolbox</strong> Home Page ...................................................................14<br />
About Report Types ...............................................................................................17<br />
NPOWER ..............................................................................................................18<br />
About <strong>Nielsen</strong> NPOWER ............................................................................18<br />
<strong>Nielsen</strong> NPOWER Reports ....................................................................................20<br />
About Co-Viewing Reports .........................................................................22<br />
About Length of Tune Reports ....................................................................22<br />
NPOWER Frequently Asked Questions ................................................................24<br />
MarketBreaks ........................................................................................................34<br />
About <strong>Nielsen</strong> MarketBreaks ......................................................................34<br />
<strong>Nielsen</strong> MarketBreaks Reports ..............................................................................35<br />
Market Breaks Frequently Asked Questions .........................................................36<br />
SSG .......................................................................................................................40<br />
About SSG ..................................................................................................40<br />
Chapter 3: <strong>National</strong> <strong>TV</strong> <strong>Toolbox</strong> Data ..................................41<br />
Displaying Data Availability ...................................................................................42<br />
Market Break Descriptions ....................................................................................43<br />
Demographic Descriptions ....................................................................................63<br />
About Universe Estimates .....................................................................................66<br />
Additional Subscriptions ........................................................................................67<br />
Additional Demographic Subscriptions .......................................................67<br />
Additional Market Breaks Subscriptions .....................................................67<br />
Chapter 4: Report Specifications Overview .......................69<br />
About the Specification Definition Page ................................................................70<br />
Creating a Specification .........................................................................................71<br />
Viewing or Editing a Report Specification ..............................................................72<br />
Sharing a Specification ..........................................................................................73<br />
Unsharing a Specification ......................................................................................74<br />
Deleting a Specification .........................................................................................75<br />
Chapter 5: Criteria Selection Pages .....................................77<br />
Selection Tabs .......................................................................................................78<br />
About Criteria Selection Pages ..............................................................................83<br />
Functions Available on Criteria Selection Pages ...................................................85<br />
Criteria Selection Toolbar ......................................................................................87<br />
About Boolean Logic .............................................................................................88<br />
Using Boolean Operators ......................................................................................90<br />
<strong>National</strong> <strong>TV</strong> <strong>Toolbox</strong> <strong>User</strong> <strong>Guide</strong><br />
Contents • iii
Creating a Nested Boolean Expression .................................................................92<br />
Chapter 6: Groups and Combos ..........................................95<br />
About Groups and Combos ...................................................................................96<br />
Working with Groups .............................................................................................98<br />
Creating a Group ...................................................................................................99<br />
Creating Groups from Shared Reports ................................................................100<br />
Creating a Combo with Combine .........................................................................101<br />
About Cross and Cross Selected ........................................................................102<br />
Creating a Combo with Cross ..............................................................................103<br />
Creating a Combo with Cross Selected ...............................................................104<br />
Chapter 7: Criteria Selection Page Descriptions ..............105<br />
Sample Page .......................................................................................................106<br />
Builder Jobs Page ...............................................................................................107<br />
Filter Page ...........................................................................................................108<br />
Viewing Type Page ..............................................................................................109<br />
Playback Period and Media Source Page ...........................................................110<br />
Measurement Interval Page ................................................................................112<br />
Unification Page ..................................................................................................116<br />
Unified Sample Page ...........................................................................................118<br />
Websites Page ....................................................................................................119<br />
Schedule Page ....................................................................................................120<br />
Advertisements Page ..........................................................................................124<br />
Programs Page ....................................................................................................126<br />
Segmentation Page .............................................................................................129<br />
Schedules Page ..................................................................................................132<br />
Schedule Pairs Page ...........................................................................................133<br />
Statistics Page .....................................................................................................134<br />
Feed Pattern Page ..............................................................................................140<br />
Frequency Distribution Page ...............................................................................141<br />
Report Segment Page .........................................................................................142<br />
Program Details Page .........................................................................................145<br />
Internet Source Page ...........................................................................................148<br />
Dayparts Page .....................................................................................................149<br />
Viewing Source Page ..........................................................................................150<br />
About Demographics ...........................................................................................151<br />
Demographics Page ............................................................................................152<br />
Co-View Pairs Page ............................................................................................154<br />
About Market Breaks ...........................................................................................155<br />
Market Breaks Page ............................................................................................156<br />
Custom Coverage Areas Page ............................................................................157<br />
Ranking Page ......................................................................................................158<br />
Format Page ........................................................................................................159<br />
Chapter 8: Reach & Frequency Schedules and Reports . 161<br />
About R&F Reports .............................................................................................162<br />
About R&F Duplication Reports ...........................................................................164<br />
Creating Reach & Frequency Reports .................................................................165<br />
About Unification .................................................................................................166<br />
Creating a Unified Sample ...................................................................................168<br />
About Schedules .................................................................................................169<br />
R & F Schedule Definition Page ..........................................................................170<br />
Contents • iv<br />
<strong>National</strong> <strong>TV</strong> <strong>Toolbox</strong> <strong>User</strong> <strong>Guide</strong>
Chapter 9: Working with Schedules ..................................171<br />
Building Schedules ..............................................................................................172<br />
Viewing or Editing a Schedule .............................................................................173<br />
Applying a Filter to a Schedule ............................................................................174<br />
Deleting a Schedule Execution ............................................................................175<br />
Deleting All Schedule Executions ........................................................................176<br />
Deactivating a Single Schedule within an Execution ...........................................177<br />
Chapter 10: Segmentation Analyses .................................179<br />
About Segmentation Reports ..............................................................................180<br />
Using Segmentations in Other Reports ...............................................................181<br />
Segmentation Reports .........................................................................................182<br />
About Quad Segmentation .......................................................................182<br />
About NTile Segmentation ........................................................................183<br />
About Number of Minutes Segmentation ..................................................183<br />
About Number of Seconds/PVs Internet Segmentation ...........................184<br />
Chapter 11: Working with Reports .....................................185<br />
Checking Report Status .......................................................................................186<br />
Viewing a Report .................................................................................................187<br />
Modifying Recurring Reports ...............................................................................188<br />
Chapter 12: Cross Platform Reporting - <strong>TV</strong>/Internet ........189<br />
About <strong>Nielsen</strong> Cross-Platform Service - Single Source .......................................190<br />
About <strong>Nielsen</strong> Cross-Platform Service - Data Fusion ..........................................191<br />
Cross-Platform - Data Fusion Frequently Asked Questions ................................192<br />
Chapter 13: Reference .........................................................199<br />
Daily Intab Counts ...............................................................................................200<br />
Daily Scaled Installed Counts ..............................................................................201<br />
Daily Scaled Intab Counts ...................................................................................202<br />
Proportionate Equivalent Sample Size ................................................................203<br />
Viewing the <strong>National</strong> Reference Supplement ......................................................204<br />
Glossary ...............................................................................205<br />
<strong>National</strong> <strong>TV</strong> <strong>Toolbox</strong> <strong>User</strong> <strong>Guide</strong><br />
Contents • v
Contents • vi<br />
<strong>National</strong> <strong>TV</strong> <strong>Toolbox</strong> <strong>User</strong> <strong>Guide</strong>
Chapter 1<br />
About <strong>National</strong> <strong>TV</strong> <strong>Toolbox</strong><br />
The <strong>National</strong> <strong>TV</strong> <strong>Toolbox</strong> provides an entry point for <strong>Nielsen</strong> services to which you subscribe such as <strong>Nielsen</strong><br />
NPOWER and <strong>Nielsen</strong> MarketBreaks.<br />
■<br />
■<br />
What's New?<br />
System Requirements<br />
<strong>National</strong> <strong>TV</strong> <strong>Toolbox</strong> <strong>User</strong> <strong>Guide</strong> About <strong>National</strong> <strong>TV</strong> <strong>Toolbox</strong> • 1-7
What's New?<br />
This release of <strong>National</strong> <strong>TV</strong> <strong>Toolbox</strong> includes the following enhancements and added functionality since the<br />
last release:<br />
Online Help Changes<br />
The <strong>National</strong> <strong>TV</strong> <strong>Toolbox</strong> online Help was redesigned. The changes are as follows:<br />
• The books in the Contents pane provide a mini-TOC with a short description of each topic.<br />
• The Glossary link is above the Contents.<br />
• The printer icon to the right of the breadcrumbs allows you to print topics.<br />
Example<br />
Measurement Interval Page<br />
The Data Availability and the Data Release Type lists on the Measurement Interval page provide a Non-<br />
Linear Program option to support a new Library VOD subscription offering.<br />
About <strong>National</strong> <strong>TV</strong> <strong>Toolbox</strong> • 1-8<br />
<strong>National</strong> <strong>TV</strong> <strong>Toolbox</strong> <strong>User</strong> <strong>Guide</strong>
Program Details Page<br />
Content Duration was added as a program indicator.<br />
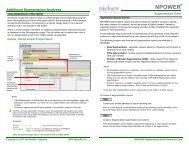
Additional Subscriptions<br />
Additional Demographic and Market Breaks subscriptions are available for <strong>Nielsen</strong> NPOWER. For more<br />
information, see the Additional Subscriptions section of the online Help or contact your <strong>Nielsen</strong> Client Service<br />
Representative.<br />
How to Reads<br />
The Simultaneous How to Read report was updated to include additional columns.<br />
The following changes were made to the Reach & Frequency suite of reports in the February 27, 2012<br />
release of <strong>National</strong> <strong>TV</strong> <strong>Toolbox</strong>:<br />
Reach & Frequency Modifications<br />
The following details, communicated on February 13, 2012, are changes to the Reach & Frequency suite of<br />
reports in <strong>Nielsen</strong> NPOWER. The modifications were implemented Monday, February 27, 2012 and affect the<br />
NPOWER ® calculated reach and frequency levels for qualified program and time-period audience schedules<br />
only. Some clients utilize these calculations for internal analysis of programming.<br />
Notes The following data and calculations are not affected and did not change:<br />
• Reach & Frequency (R&F) Report calculations based on advertisement or promotional schedules<br />
• All NPOWER program and time-period schedules that were processed on Live-only data<br />
• Commercial, C3 / ACM, ratings, and other reports and statistics available in NPOWER<br />
Enhancements to Calculations<br />
Qualified Program & Time Period Frequency Calculations<br />
<strong>National</strong> <strong>TV</strong> <strong>Toolbox</strong> <strong>User</strong> <strong>Guide</strong> About <strong>National</strong> <strong>TV</strong> <strong>Toolbox</strong> • 1-9
Qualified program and time-period schedules for frequency-based metrics are now based on the number of<br />
different content minutes viewed that pass the selected qualifier. This change ensures that these breaks in<br />
linear viewing are not counted as additional frequencies of viewing when the fast-forward, rewind, and pause<br />
functions are used during DVR playback using a DVR or VOD.<br />
Note Frequency-based statistics include: Qualified GRP % / (000) and Frequency Distribution if selected.<br />
Qualified Program & Time Period Reach & Frequency Schedules Calculations<br />
Qualified reach and frequency is now based on distinct/unique minutes, and repeat viewing of the same<br />
minutes does not count toward meeting the cume qualifier. Prior to this change, for data beginning February<br />
2011, the data were based on "ANY" minutes, even if the same content minute was viewed six times. This<br />
change ensures that these breaks in linear viewing are not counted as additional frequencies of viewing for a<br />
telecast when calculated in NPOWER when the fast-forward, rewind, and pause functions are used during<br />
DVR playback using a DVR or VOD.<br />
This enhancement is also implemented on the R&F Duplication reports for the reach metrics.<br />
Note This does not apply to reports using a one-minute qualifier.<br />
New Apply Distinct Processing Option<br />
When selected, this option processes Average Frequency and Average Minutes without duplicate viewing. By<br />
selecting the "Apply Distinct Processing" option on the Statistics page, users who do programming research<br />
are now able to analyze how many different episodes of a series a viewer watched. <strong>User</strong> Preferences now<br />
provides the option to set this as the default reach and frequency methodology if desired.<br />
Notes<br />
• Advertisement schedules should always be evaluated with the default frequency methodology (without<br />
the Apply Distinct Processing option selected), which counts any repeat viewing of commercial<br />
minutes.<br />
• Frequency-based statistics include: Qualified GRP % / (000) and Frequency Distribution if selected.<br />
• Average minute-based statistics include: Spot GRP % / (000.)<br />
Helpful Reach & Frequency Questions<br />
Q1. How do I compare program and/or time-period data prior to February 2011 to current data?<br />
A1. There are two options:<br />
a) To report unique viewers only:<br />
– Process the pre-February 2011 data using the AA Reach Type.<br />
– Process the post-February 2011 data using the AA Reach Type with the "Apply Distinct<br />
Processing" option selected for program or time-period schedules.<br />
b) To report all viewing (duplicates):<br />
– Process the pre-February 2011 data using the GAA Reach Type with the "Allow Non-Ordered<br />
GAA" option selected.<br />
– Process the post-February 2011 data using the AA Reach Type without the "Apply Distinct<br />
Processing" option selected.<br />
Q2. For current data, can I compare non-multiprocessed (duplicate) to multiprocessed data<br />
(unique)?<br />
A2. Yes, however, after creating the unifications and schedules you want to use, it requires two reports:<br />
a) A R&F Report without the "Apply Distinct Processing" option selected. This report will include the<br />
duplicate viewers in the Average Frequency/Average Minute metrics.<br />
b) Then edit that report and select the "Apply Distinct Processing" option. This report will exclude all<br />
duplicate viewing and will align to the old multiprocessed methodology. The Reach in each report<br />
should be the same.<br />
About <strong>National</strong> <strong>TV</strong> <strong>Toolbox</strong> • 1-10<br />
<strong>National</strong> <strong>TV</strong> <strong>Toolbox</strong> <strong>User</strong> <strong>Guide</strong>
Q3. Why were the Reach & Frequency enhancements made?<br />
A3. They are an adjustment to the duplicate audience incorporated into the AA calculation in February<br />
2011, which was made to better capture multiple viewings of programs in <strong>TV</strong> homes.<br />
Q4. Are there additional details for how the new option to process Average Frequency and<br />
Average Minutes excluding duplicate viewing will work?<br />
A4. While the default methodology for NPOWER's Average Frequency and Average Minutes<br />
calculations will continue to include any duplicate viewing, an "Apply Distinct Processing" option<br />
was added to the Statistics page. If selected, Average Frequency, Average Minutes, and their<br />
dependent statistics will exclude duplicate viewing. By selecting this option, users who do<br />
programming research will now be able to analyze how many different episodes of a series a viewer<br />
watched. Qualified audience schedules submitted with this option selected will trend with historical<br />
multiprocessed data for periods prior to the duplicate viewing calculation changes made in February<br />
2011. Using this option, the highest possible frequency is 1 per telecast.<br />
Notes – Advertisement schedules should always be evaluated using the default frequency<br />
methodology, which counts any repeat viewing of commercial minutes. For program or time-period<br />
schedules, the NPOWER user will be able to choose to evaluate their frequency differently,<br />
depending on the purpose of their analysis.<br />
– Frequency-based statistics include: Qualified GRP % / (000) and Frequency Distribution if<br />
selected.<br />
– Average minute-based statistics include: Spot GRP % / (000).<br />
As noted above, although the Spot GRP% / (000) changes, if this option is selected, advertisement<br />
schedules are always evaluated with the default methodology.<br />
Q5. Was any impact data provided with this change?<br />
A5. Yes. Contact your <strong>Nielsen</strong> Client Service Representative for supporting analyses.<br />
Q6. Was there an effect on C3 or Program MIT files, local reporting, or local data files?<br />
A6. No. This change is limited to qualified program and time-period frequency data within NPOWER's<br />
Reach & Frequency Reports.<br />
Q7. Is NPOWER data for Local People Meter Markets affected?<br />
A7. Some clients have access to Reach & Frequency data for Local People Meter markets and samples<br />
from NPOWER. NPOWER time-period frequency data, reported within Local People Meter markets,<br />
will also benefit from the calculation enhancements. NPOWER does not report program data for<br />
Local People Meter markets.<br />
Q8. How do I analyze unique episodes across an interval/season?<br />
A8. Prior to February 2011, the default AA methodology was multiprocessed and excluded all duplicate<br />
viewing. Processing with the AA Reach Type for historical data provides this type of analysis. For<br />
data beginning February 2011, to perform this analysis you should run the AA Reach Type with the<br />
"Apply Distinct Processing" option selected. This will exclude any duplicate viewing and will align<br />
with the old multiprocessed methodology.<br />
<strong>National</strong> <strong>TV</strong> <strong>Toolbox</strong> <strong>User</strong> <strong>Guide</strong> About <strong>National</strong> <strong>TV</strong> <strong>Toolbox</strong> • 1-11
System Requirements<br />
Your PC should meet the minimum requirements listed below to achieve the best performance.<br />
Hardware Requirements<br />
The following are the minimum hardware requirements for <strong>National</strong> <strong>TV</strong> <strong>Toolbox</strong>:<br />
• IBM Compatible PC with 850 MHz or higher processor clock speed. 1.2 GHz recommended.<br />
Examples:<br />
• Intel Pentium Celeron family<br />
• AMD K6/Athlon/Duron family<br />
• 256 megabytes (MB) RAM or higher recommended. 512 MB memory will enhance performance and<br />
user experience.<br />
• 1 gigabyte (GB) of available hard disk space.<br />
• Super VGA 1024 x 768 or higher resolution video adapter and monitor. See the procedure below to<br />
set your screen resolution.<br />
• HP LaserJet III or better printer.<br />
• Keyboard and Microsoft ® mouse or compatible pointing device.<br />
Software System Requirements<br />
The following are the recommended software requirements:<br />
• Windows ® 2000 with Internet Explorer ® 5.5, SP2 or higher or Windows ® XP with Internet Explorer ® 6.0<br />
or higher<br />
Note NPOWER ® and MarketBreaks ® are fully compliant with Internet Explorer ® 8.0.<br />
• Microsoft Office ® 2000+ (specifically Microsoft Excel)<br />
• Adobe ® Reader ® 7 or higher<br />
• Flash Player 8.x+<br />
• Pop-up blockers turned off<br />
Setting Screen Resolution<br />
To minimize scrolling to view information, your screen resolution should be set to 1024 X 768 or higher.<br />
1. From your desktop, click Start, point to Settings, and then click Control Panel.<br />
2. From the Control Panel window, double-click Display. The Display Properties dialog box opens.<br />
3. From the Display Properties dialog box, click the Settings tab.<br />
4. In the Screen resolution area, move the slider bar until it displays 1024 x 768 pixels, and then click<br />
OK.<br />
About <strong>National</strong> <strong>TV</strong> <strong>Toolbox</strong> • 1-12<br />
<strong>National</strong> <strong>TV</strong> <strong>Toolbox</strong> <strong>User</strong> <strong>Guide</strong>
Chapter 2<br />
The <strong>National</strong> <strong>TV</strong> <strong>Toolbox</strong> Workspace<br />
The <strong>National</strong> <strong>TV</strong> <strong>Toolbox</strong> workspace provides access to NPOWER and MarketBreaks reports and<br />
functionality.<br />
■<br />
■<br />
■<br />
■<br />
■<br />
■<br />
■<br />
■<br />
■<br />
The <strong>National</strong> <strong>TV</strong> <strong>Toolbox</strong> Home Page<br />
About Report Types<br />
NPOWER<br />
<strong>Nielsen</strong> NPOWER Reports<br />
NPOWER Frequently Asked Questions<br />
MarketBreaks<br />
<strong>Nielsen</strong> MarketBreaks Reports<br />
Market Breaks Frequently Asked Questions<br />
SSG<br />
<strong>National</strong> <strong>TV</strong> <strong>Toolbox</strong> <strong>User</strong> <strong>Guide</strong> The <strong>National</strong> <strong>TV</strong> <strong>Toolbox</strong> Workspace • 2-13
The <strong>National</strong> <strong>TV</strong> <strong>Toolbox</strong> Home Page<br />
The <strong>National</strong> <strong>TV</strong> <strong>Toolbox</strong> home page is the entry point to the <strong>Nielsen</strong> services you subscribe to. This page is<br />
the starting point from which you can access all available reports and functions.<br />
The table below describes the elements of the page.<br />
Page Element<br />
Menu Bar<br />
Description<br />
The menu bar is always visible on the <strong>National</strong> <strong>TV</strong> <strong>Toolbox</strong> pages.<br />
• Home - Click to return to the <strong>National</strong> <strong>TV</strong> <strong>Toolbox</strong> home page from any<br />
other page.<br />
• Options - Click to set your default user preferences:<br />
• E-Mail Notifications - Select Yes to receive e-mail notification when<br />
your report request is completed. Select No if you do not want to<br />
be notified.<br />
• Open Folders - Select Yes to have all criteria selection folders<br />
expanded (open) by default. Select No to have the criteria<br />
selection folders collapsed (closed).<br />
• Display Custom PROJ - Select Yes to include custom projections<br />
in your output. Select No to display projections for standard UEs<br />
only.<br />
• Exclude Sample Info - Select Yes to exclude sample information<br />
from your output. Select No to report sample information.<br />
• Calendar Service- Select the default calendar service for the<br />
Measurement Interval page.<br />
• Format Excel - Select Yes to have Microsoft Excel output files<br />
formatted in color. Select No to have Microsoft Excel output files<br />
formatted in black and white.<br />
• Qualified Audience - Select the default for the Qualified Audience<br />
minutes displayed on the Statistics page of <strong>Nielsen</strong> NPOWER<br />
Reach & Frequency Reports.<br />
• CSV Output - Select Yes to set CSV output as the default for<br />
reports that include CSV as an output option. Select No to select<br />
the CSV output option manually on any reports with CSV as an<br />
output option.<br />
• Apply Distinct Processing - Select Yes to apply this option to<br />
Reach & Frequency Reports by default. When this option is<br />
The <strong>National</strong> <strong>TV</strong> <strong>Toolbox</strong> Workspace • 2-14<br />
<strong>National</strong> <strong>TV</strong> <strong>Toolbox</strong> <strong>User</strong> <strong>Guide</strong>
Page Element<br />
Description<br />
selected, Average Frequency and Average Minutes are processed<br />
without duplicate viewing. Select No to apply this option manually<br />
on Reach & Frequency Reports.<br />
Note If this option is set to Yes, when running Advertisement<br />
schedules, remember to clear the Apply Distinct Processing check<br />
box on the Statistics page. Advertisement schedules should count<br />
any repeat viewing of commercial minutes.<br />
• Help<br />
• Contents - Select this option to open Help to the first page of the<br />
Table of Contents. Use this when you are browsing Help for<br />
general information.<br />
• Current Page Help - Select this option to open Help to information<br />
specific to the page currently displayed.<br />
• <strong>User</strong> - Identifies the user who is currently logged on.<br />
Toolbar<br />
•<br />
•<br />
•<br />
•<br />
- Refresh Page<br />
- New Spec<br />
- Open Spec<br />
- Delete (Shift+Delete)<br />
Navigation Pane<br />
Job Specifications Tab<br />
The navigation pane is the report menu for the <strong>National</strong> <strong>TV</strong> <strong>Toolbox</strong>. The menu<br />
lists available reports depending on services within your <strong>Nielsen</strong> subscriptions.<br />
Saved specifications.<br />
Jobs Tab<br />
Report requests that have been submitted (executions).<br />
Report Output<br />
Shortcut Menus<br />
The Report Output column is on the Jobs tab. Reports are generated as an<br />
Excel workbook and also as a zipped Excel file. Click the icon to view the<br />
report in Excel format or to download the file in zipped format.<br />
The <strong>National</strong> <strong>TV</strong> <strong>Toolbox</strong> home page provides shortcut menus that provide<br />
quick access to the commands available from the home page toolbar as well<br />
as additional commands depending on which tab you are on.<br />
Jobs Tab Shortcut Menu • Delete Selection - Deletes the currently selected specification(s).<br />
• Reprocess Selection - Submits the selection for reprocessing.<br />
Note This option is only available for the Trend Analysis Program<br />
Builder.<br />
• New Spec - Creates a new specification of the type selected in the<br />
navigation pane.<br />
• Open Spec As - Allows you to apply criteria selections from an existing<br />
report execution to a new report of a different type.<br />
Note When you select an execution and then right click and apply<br />
this command, any criteria selections of that execution that could also<br />
apply to the report type you select from the pop-up menu are<br />
automatically applied to the new specification definition.<br />
• Refresh Page - Provides an alternative option for refreshing the page.<br />
<strong>National</strong> <strong>TV</strong> <strong>Toolbox</strong> <strong>User</strong> <strong>Guide</strong> The <strong>National</strong> <strong>TV</strong> <strong>Toolbox</strong> Workspace • 2-15
Page Element<br />
Description<br />
• Save Execution(s) to disk - Allows you to download up to 200 jobs at<br />
once.<br />
Job Specifications Tab Shortcut<br />
Menu<br />
• Modify Measurement Interval - Allows you to quickly change the end<br />
measurement interval for the existing scheduled reports. It is primarily<br />
focused on extending the MarketBreak Trend Builders into the future,<br />
but can be used for any <strong>National</strong> <strong>TV</strong> <strong>Toolbox</strong> specification, NPOWER<br />
and/or MarketBreaks, that is currently scheduled.<br />
Note If you accidentally ‘scheduled’ your original Builder using an incorrect<br />
data availability option, this feature will not change the data type option<br />
previously selected. You will need to restart the Trend Builder from scratch if<br />
that is the case.<br />
The <strong>National</strong> <strong>TV</strong> <strong>Toolbox</strong> Workspace • 2-16<br />
<strong>National</strong> <strong>TV</strong> <strong>Toolbox</strong> <strong>User</strong> <strong>Guide</strong>
About Report Types<br />
The report types available from the <strong>National</strong> <strong>TV</strong> <strong>Toolbox</strong> are listed in the navigation pane on the home page.<br />
Access to reports and samples is determined by your contract with The <strong>Nielsen</strong> Company. For more<br />
information, contact your <strong>Nielsen</strong> Client Services Representative.<br />
Program reports are especially helpful if you want to compare program ratings for different programs or<br />
season-to-date tracking of a specific program. Program reports show you the entire program, including any<br />
overtime, until the program ends. Time period reports provide information based on the time slots you select.<br />
Examples<br />
• You select a program report for Monday Night Football. The report considers the entire program until<br />
the program ends, including all overtime.<br />
• You select a time period report for Monday from 9:00 - 11:00 p.m. when Monday Night Football is<br />
scheduled to air. If that football game runs into overtime, your report will not take overtime into<br />
consideration and you will not have any ratings information for the overtime airing. Your data will be<br />
based on the fixed time period.<br />
<strong>National</strong> <strong>TV</strong> <strong>Toolbox</strong> <strong>User</strong> <strong>Guide</strong> The <strong>National</strong> <strong>TV</strong> <strong>Toolbox</strong> Workspace • 2-17
NPOWER<br />
This section provides NPOWER overview and reference information.<br />
About <strong>Nielsen</strong> NPOWER<br />
NPOWER, The <strong>Nielsen</strong> Company’s national custom analysis system, is a powerful tool that offers an<br />
unparalleled ability to focus on very specific audience characteristics and opens opportunities for detailed<br />
analysis of national television media.<br />
NPOWER ® employs a respondent-level data warehouse that subscribers access through a browser-based<br />
interface.<br />
Audience estimates can be generated, not only for all standard demographics and market breaks, but also for<br />
expanded audience characteristics that cannot be accessed anywhere else.<br />
NPOWER Key Features<br />
• Accesses respondent-level data for the <strong>National</strong> People Meter (<strong>National</strong>) sample, the <strong>National</strong><br />
Hispanic People Meter (NHPM - Pre September 2007) sample, Cross-Platform Homes (beginning<br />
December 2009), and the <strong>National</strong> People Meter Hispanic (Hispanic) sample through browser-based<br />
custom analysis applications.<br />
• Enhanced usability.<br />
• Fast and consistent processing time.<br />
• Boolean logic (AND, OR, NOT logic) available for market breaks, custom coverage areas, and viewing<br />
sources.<br />
• Ability to average across larger measurement intervals.<br />
• <strong>National</strong> commercial rating averages and indices to the program average.<br />
• View report results in Microsoft Excel format.<br />
NPOWER provides the following report types:<br />
• Ratings Analysis<br />
• Reach & Frequency<br />
• Segmentation<br />
• Source & Destination<br />
• Universe Estimate<br />
• Co-Viewing<br />
• Length of Tune<br />
• PowerPlay<br />
Additional subscriptions available are:<br />
• <strong>Nielsen</strong> PRIZM<br />
• Multiple <strong>Nielsen</strong> Data Fusions<br />
• <strong>Nielsen</strong> Cross-Platform Homes Internet Reporting<br />
• Simmons BehaviorGraphics <br />
• <strong>Nielsen</strong> Principal MovieGoer<br />
Software Upgrades<br />
Because NPOWER is a browser-based application, the software resides on the <strong>Nielsen</strong> server. Software<br />
updates are rolled out on predefined dates without requiring any action on your part.<br />
The <strong>National</strong> <strong>TV</strong> <strong>Toolbox</strong> Workspace • 2-18<br />
<strong>National</strong> <strong>TV</strong> <strong>Toolbox</strong> <strong>User</strong> <strong>Guide</strong>
How can I learn more about NPOWER?<br />
To learn more about NPOWER or to request NPOWER training classes, contact your <strong>Nielsen</strong> Client Services<br />
Representative. You may also contact the <strong>Nielsen</strong> Solutions Center at 1.800.423.4511 or e-mail:<br />
prodhelpline@nielsen.com.<br />
Tip <strong>Nielsen</strong> U provides additional recorded training sessions at answers.nielsen.com. Use the Help & Learn<br />
menu to open the Help & Learn Main Page, which provides access to <strong>Nielsen</strong> U.<br />
<strong>National</strong> <strong>TV</strong> <strong>Toolbox</strong> <strong>User</strong> <strong>Guide</strong> The <strong>National</strong> <strong>TV</strong> <strong>Toolbox</strong> Workspace • 2-19
<strong>Nielsen</strong> NPOWER Reports<br />
<strong>Nielsen</strong> NPOWER provides reports that allow you to analyze national television viewing by focusing on<br />
specific audience characteristics.<br />
Access to reports and samples is determined by your contract with The <strong>Nielsen</strong> Company. For more<br />
information, contact your <strong>Nielsen</strong> Client Services Representative.<br />
Ratings Analysis<br />
These are standard program and time period reports, which also offer the added option to produce timeshifted<br />
viewing analyses.<br />
Note To further analyze time-shifted viewing (TSV), select a playback period from the Playback Period and<br />
Media Source selection tab.<br />
• Ratings Analysis Program Report - allows you to produce individual ratings reports based on<br />
program data and dayparts, and allows you to analyze national commercial clock minute data.<br />
Averaging intervals include program selection, originator, program, program trackage, program<br />
episode, telecast, or minute. Additional averaging levels are also available. Program reports can be<br />
run for broadcast, cable, and syndication programs.<br />
• Ratings Analysis Time Period Report - allows you to produce individual minute ratings reports<br />
based on time period data. Averaging levels include total daypart or daypart, hour, half-hour, quarter<br />
hour, or minute. Time period reports are useful for obtaining data for those broadcast or cable<br />
networks who do not supply The <strong>Nielsen</strong> Company with program lineups. Time period reports are<br />
sorted according to the defined daypart and do not take program or length of program into<br />
consideration.<br />
Unification<br />
This is a process that applies restrictions to the homes included in the sample based on the type of unification<br />
selected and the measurement period to create a unified sample. The unified sample can then be used for<br />
other reports.<br />
Note This is a process to generate qualified households or people; it does not create actual report output.<br />
Reach & Frequency Schedules<br />
Create schedules and run reports based on those schedules to determine the number of households or<br />
persons reached by a schedule and the number of times they were reached.<br />
In NPOWER, you can create the following schedules:<br />
• R&F Advertisement Schedule - contains exact national commercial minutes with advertisements<br />
that aired in programs during the measurement interval for the selected advertiser, brand, or brand<br />
variant.<br />
• R&F Program Schedule - contains selected minutes of programs that aired during the measurement<br />
interval. You may also choose to include only the minutes of the program where a national commercial<br />
was aired.<br />
• R&F Time Period Schedule - contains selected minutes of time period dayparts for viewing sources<br />
during the measurement interval.<br />
• R&F Internet Schedule (subscription based) - contains selected minutes of dayparts for Internet<br />
sources during the measurement interval.<br />
• R&F Upload Schedule - contains selected minutes of time period or program sources during the<br />
measurement interval.<br />
Notes<br />
• The Qualified Audience parameter is selected at the report level from the Statistics page of the R&F<br />
Report and the R&F Duplication Report.<br />
The <strong>National</strong> <strong>TV</strong> <strong>Toolbox</strong> Workspace • 2-20<br />
<strong>National</strong> <strong>TV</strong> <strong>Toolbox</strong> <strong>User</strong> <strong>Guide</strong>
• Combo schedules are created in the Schedules page of the R&F Report and the R&F Duplication<br />
Report.<br />
Reach & Frequency Reports<br />
These are schedule-based reports.<br />
• R&F Report - provides unduplicated audience estimates and frequency of viewing for one schedule or<br />
a series of selected units (advertisement, telecast, or daypart) for various market breaks and<br />
demographics.<br />
Note To perform a Progressive Cume, select the option on the Statistics page in R&F reports. In<br />
addition, a detail level report segment is required. This is typically called a Reach curve.<br />
• R&F Duplication Report - analyzes the viewing of schedule pairs and determines the additional<br />
viewers reached by combining them. This report calculates the number of households or persons<br />
reached by each schedule separately, the number reached by a combination of the schedules, and<br />
the number reached by both schedules. This report type is used to create an Only Only Both report.<br />
Segmentation<br />
Segmentation reports allow you to analyze audience viewing habits to identify heavy viewers and light<br />
viewers of a network. The following program and time period segmentation reports are available in<br />
NPOWER:<br />
• Quad Segmentation - separates viewers/page views based on frequency and duration to determine<br />
your loyal viewers/site visitors.<br />
• NTile Segmentation - divides viewing households/persons or Internet source users into even groups<br />
to rank your <strong>TV</strong> viewers/Internet users.<br />
• Number of Minutes Segmentation - divides viewers into two groups (top viewers or bottom viewers)<br />
based on whether they met the qualifier.<br />
• Number of Seconds/PVs Internet Segmentation (subscription based) - divides Internet users into<br />
two groups (top Internet users or bottom Internet users) based on number of seconds or number of<br />
page views requested.<br />
Notes<br />
• Share of Viewing can be run in ratings reports, and is a statistic called Sum of Sources Distribution<br />
(SOV).<br />
• Profile Demographics and Profile Market Breaks are now selection tabs on Segmentation reports.<br />
• Internet data is not valid for the household level, it is only available for the person level.<br />
Source & Destination<br />
<strong>Nielsen</strong> NPOWER source and destination time-based or program-based reports further examine the flow of<br />
viewing. While the minute-by-minute report identifies the minute tuning level, source and destination identifies<br />
where the viewers of a specific minute came from and where they went. Additionally, the calculations are setbased,<br />
meaning the duplication within a household or a person is not multi-processed out and each viewing<br />
event is followed. The report can be produced for a selected time period or program.<br />
• Source & Destination Program Report - allows you to produce source and destination ratings and/<br />
or distributions for each target MOP requested, based on selected programs.<br />
• Source & Destination Time Period Report - allows you to produce source and destination ratings<br />
and/or distributions for each target minute requested, based on selected viewing source daypart.<br />
Universe Estimate<br />
UE and Sample Information - allows you to examine the sample sizes and weighted universe estimates for<br />
the dates, demographics, and market breaks selected.<br />
<strong>National</strong> <strong>TV</strong> <strong>Toolbox</strong> <strong>User</strong> <strong>Guide</strong> The <strong>National</strong> <strong>TV</strong> <strong>Toolbox</strong> Workspace • 2-21
Co-Viewing<br />
Co-Viewing Program Report - allows you to examine pairs of viewers who watched the same program on<br />
the same set at the same time.<br />
Length of Tune<br />
Length of Tune reports (LOT/LOV) examine the average length of tuning for a viewing source daypart (LOT)<br />
or average length of viewing for a viewing event for an originator, program, and/or program trackage (LOV).<br />
The Length of Tune report is an essential research tool used to determine the strength and appeal of a<br />
program or daypart for a network. It is also used to assess the impact of changes to program formatting,<br />
which helps to schedule programs more effectively.<br />
• LOT Time Period Report - allows you to produce averages and distributions for tuning events of<br />
varying lengths for a daypart and viewing source.<br />
• LOV Program Report - allows you to produce averages and distributions for viewing events of<br />
various lengths to a program for an originator, program, and/or program trackage.<br />
PowerPlay<br />
These are program and time period rating reports that can be analyzed using <strong>Nielsen</strong>'s PowerPlay ® tool.<br />
They are created in the same manner as standard program and/or time period ratings analyses reports;<br />
however, options differ for report segment and statistics. The NPOWER zip file is then opened in the<br />
PowerPlay tool for further analysis.<br />
About Co-Viewing Reports<br />
Co-Viewing analyses provide ratings and share by demographics and co-viewing group for particular<br />
programs.<br />
Co-Viewing analyses provide detailed information regarding the degree to which people from one group<br />
watch the same television set with people from another group. These groups can be used to promote the<br />
shared viewing experience to advertisers targeting more than one audience. In addition, we offer the<br />
functionality to report on people watching alone. You are not limited to reporting mutually exclusive<br />
demographics between co-view pairs, and the report can be run for multiple demographics and market<br />
breaks in a single execution.<br />
Co-Viewing reports help answer the following questions:<br />
• Are kids and adults watching television together?<br />
• Is my network better at delivering co-viewing than my competitors?<br />
• What programs on my network or my competitor's network have the highest co-viewing among men<br />
and women?<br />
• Are there certain times of the day when co-viewing is the highest?<br />
• How does co-viewing data differ between Live and Most Current viewing?<br />
• What programs promote alone viewing?<br />
• Which programs attract like viewing, for example, Females 25-34 watching with Females 25-34?<br />
Note Co-Viewing reports are based on Live or Most Current GAA data only.<br />
About Length of Tune Reports<br />
Length of Tune reports (LOT/LOV) examine the average length of tuning for a viewing source daypart (LOT)<br />
or average length of viewing for a viewing event for an originator, program, and/or program trackage (LOV).<br />
The Length of Tune report is an essential research tool used to determine the strength and appeal of a<br />
program or daypart for a network. It is also used to assess the impact of changes to program formatting,<br />
which helps to schedule programs more effectively.<br />
Length of Tune reports help answer the following questions:<br />
• In general, is my network retaining viewers for long or short tuning episodes?<br />
The <strong>National</strong> <strong>TV</strong> <strong>Toolbox</strong> Workspace • 2-22<br />
<strong>National</strong> <strong>TV</strong> <strong>Toolbox</strong> <strong>User</strong> <strong>Guide</strong>
• Should my network air a 30-minute or 60-minute program or event?<br />
• Is my program format effective?<br />
• Do viewers stay for high profile events?<br />
• How effective was a particular promotional spot or lead-in?<br />
• Do certain program types hold viewers longer?<br />
• How often do viewers tune to my network?<br />
• How often do viewers tune to my competition?<br />
• Within my genre, how does my network's length of tuning compare to similar networks?<br />
• Are my higher/lower ratings due to longer/shorter viewing episodes?<br />
Notes<br />
• Length of Tune reports are Live-based only.<br />
• See Report Segment Page for more information on LOT/LOV Events.<br />
<strong>National</strong> <strong>TV</strong> <strong>Toolbox</strong> <strong>User</strong> <strong>Guide</strong> The <strong>National</strong> <strong>TV</strong> <strong>Toolbox</strong> Workspace • 2-23
NPOWER Frequently Asked Questions<br />
NPOWER frequently asked questions and answers are provided for reference purposes.<br />
General<br />
Q1. What are the operating hours for <strong>Nielsen</strong> NPOWER?<br />
A1. Monday-Friday 8 a.m.-12 a.m. Eastern time.<br />
Q2. What preferences can I set, and how can I set them?<br />
A2. <strong>User</strong>s can set preferences for the following:<br />
- E-mail Notifications: Yes or No<br />
- Open Folders: Yes or No<br />
- Display Custom PROJ: Yes or No<br />
- Exclude Sample Info: Yes or No<br />
- Calendar Service: NTI, NHI, NSS or BCST<br />
- Format Excel: Yes or No<br />
- CSV Output: Yes or No<br />
- Apply Distinct Processing: Yes or No<br />
Note From the <strong>National</strong> <strong>TV</strong> <strong>Toolbox</strong> home page menu, click Options, and then click Preferences.<br />
Q3. How can I see the contents of a folder?<br />
A3. Click the arrow to the left of a folder name to open the folder. Click the arrow again to close the<br />
folder.<br />
You can specify the default setting for folders to be open, if desired.<br />
Note From the <strong>National</strong> <strong>TV</strong> <strong>Toolbox</strong> home page menu, click Options, and then click Preferences.<br />
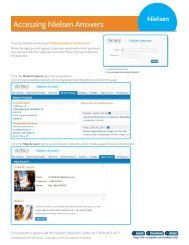
Q4. Where can I find a list of cable network feed patterns and programming hours?<br />
A4. For a complete list of feed patterns and programming hours for all reportable cable networks, please<br />
refer to the <strong>National</strong> Report Library by following the steps below. (These reports are updated<br />
quarterly.)<br />
1. From the <strong>Nielsen</strong> Answers ® Portal menu bar, click Delivery.<br />
2. From the menu panel on the left, click <strong>National</strong> Report Library.<br />
3. From the <strong>National</strong> Report Library page, click the arrow to expand All Reports and also expand<br />
<strong>National</strong> Reference Data (RDN).<br />
4. From the <strong>National</strong> Reference Data (RDN) list, click Cable Network Reference.<br />
5. From the right pane, click Cable Network Reference. The File Download dialog box opens.<br />
6. From the File Download dialog box, do one of the following:<br />
- Click Open to open the report.<br />
- Click Save to save the report to your PC.<br />
Q5. Why aren't all networks in the NAD report available?<br />
A5. NPOWER only includes networks that receive daily data.<br />
Q6. How are combos different from groups?<br />
A6. Combo - A combo is custom criteria composed of two or more individual selections. Combo names<br />
appear as rows on the output worksheets. The selections included in the combo do not appear<br />
The <strong>National</strong> <strong>TV</strong> <strong>Toolbox</strong> Workspace • 2-24<br />
<strong>National</strong> <strong>TV</strong> <strong>Toolbox</strong> <strong>User</strong> <strong>Guide</strong>
individually, unless Retain Combo Parts was selected prior to creating the combo. Individual combo<br />
contents are included on the boilerplate.<br />
Group - A group is a named collection of criteria saved for later use. Selections are saved by group<br />
name on your NPOWER ID. Group names do not appear on reports; each individual criterion within<br />
the group appears on reports. Combos can be included as part of a group.<br />
Q7. How does the Cross command differ from the Combine command?<br />
A7. Cross - When you use the Cross command, combos are created automatically from within the<br />
Current Selections list. When you right-click the primary criteria and select Cross, each criteria in<br />
the list is crossed with the primary criteria. The resulting combos created are in an AND relationship.<br />
Note Use the Cross Selected command to cross only highlighted criteria.<br />
Combine - When you use the Combine command, you must manually highlight the criteria you<br />
want to combine for each combo, apply the Combine command, and then name each combo. The<br />
default relationship for combos is an OR relationship.<br />
Q8. How can I share my report specifications and report executions?<br />
A8. When saving or submitting report specifications, click the Shared? box on the Specification<br />
Definition page. To remove Report Specifications or Report Executions from the shared folder, open<br />
the report, click the Shared? box again to clear the selection, and then save once again.<br />
Q9. Can I share groups?<br />
A9. No. Your groups exist only on your ID; however, you can share a report that has the group created<br />
as a Current Selection, and then the secondary user can open the shared report and save its<br />
contents as groups on their own IDs.<br />
Q10. What do the error messages on the Specification Definition page mean?<br />
A10. This report name already exists.<br />
You cannot save a report with the same name as one that already exists. This is to avoid<br />
overwriting existing Report Specifications. Please rename and save again.<br />
This spec exceeds allotted processing time.<br />
A flexible algorithm is applied to all specs when submitted in order to approximate report run time<br />
and prevent very long processing and queue times. This error message appears if you have<br />
selected a combination of telecasts, MOPs, statistics, market breaks, demos, viewing sources, and<br />
custom coverage areas that exceed the formula. If you receive this message, please reduce the<br />
number of selections in your report specification and submit it again.<br />
This spec exceeds memory limitations.<br />
Prior to run time, all specs are reviewed to determine the number of internal rows of data that will be<br />
generated. Even though Excel allows for 64,000 rows of data, we have a memory limitation of<br />
40,000 internal rows when processing reports. This limitation is typically reached when a user<br />
selects a large number of telecasts or MOPs to include in a report. If you receive this message,<br />
please cut back your report specs and submit again.<br />
Measurement Interval must match type of Unification.<br />
When creating a standard unification, the unification selected must match the measurement interval.<br />
For example, you cannot select monthly unification and then select a week for the measurement<br />
interval.<br />
The system failed to process your request at this time.<br />
The report specification has an invalid selection, or a value has been changed.<br />
Unification selection invalid.<br />
Pre-run unifications that have not been used in a report are rolled off from the report executions. If<br />
you receive this message, open the unification specification and submit it again.<br />
<strong>National</strong> <strong>TV</strong> <strong>Toolbox</strong> <strong>User</strong> <strong>Guide</strong> The <strong>National</strong> <strong>TV</strong> <strong>Toolbox</strong> Workspace • 2-25
This spec exceeds the allocations limit.<br />
This error message appears if the report results exceed a pre-determined allocation limit. If you<br />
receive this message, please reduce the number of selections in your report specification and<br />
submit again.<br />
This spec exceeds the schedule limit.<br />
This error message appears if the report results exceed a pre-determined schedule limit. If you<br />
receive this message, please reduce the number of selections in your report specification and<br />
submit again.<br />
This spec exceeds Excel Limits.<br />
This is usually within Source & Destination reports.<br />
Q11. How can I print report specifications?<br />
A11. Click the Print Specification icon in the top, right corner of the Specification Definition page.<br />
Note The latest version of Adobe Reader is required. For more information, see the System<br />
Requirements topic.<br />
Q12. Why didn't I get any data back in my report?<br />
A12. Most likely, you selected a measurement interval that is not yet available. Refer to the Data<br />
Availability on the Measurement Interval page to find out what data is currently available.<br />
Another possibility is that you made illogical selections when defining the spec, for example, you<br />
select a market break that became effective July 2005 and then select a measurement interval of<br />
April 2004. Check your selections again carefully. See UE Types and Effective Dates in the<br />
Reference section of the online Help under NPM Sample Info for more info.<br />
Q13. How do I know what data is available?<br />
A13. Check the Data Availability tab on the Measurement Interval page or check the Data Delivery<br />
Schedule in Help. NPOWER has data back to 08/27/01 going forward.<br />
Q14. Can I select a measurement interval larger than one quarter?<br />
A14. It is recommended that your measurement interval be limited to one quarter or less. If you choose a<br />
large measurement interval, with a select number of telecasts, your report may be within the<br />
processing limits and run successfully. However, the number of telecasts or dayparts selected,<br />
along with the number of statistics, demographics, and market breaks selected may make the report<br />
too large to process. If this is the case, a message is displayed on the Specification Definition page<br />
when the request is submitted to let you know that your report spec exceeds limitations. You can,<br />
however, schedule the report as a recurring report, resubmit the request, and then combine the<br />
output using PowerPlay .<br />
Q15. I'm trying to add multiple measurement intervals to the Criteria Selection pane, but each one<br />
I add is overwriting the previously added measurement interval. Why?<br />
A15. Only one measurement interval can be selected on a scheduled report. Multiple measurement<br />
intervals are only allowed when running one-time-only (OTO) reports.<br />
Q16. How can I schedule a report based on broadcast weekly data?<br />
A16. Each of the data releases included on the Data Availability can be selected from the drop-down list<br />
in the Schedule Report section of the Measurement Interval page once a recurring interval is<br />
selected. This includes each of the time-shifted viewing types and the Broadcast Weekly data<br />
release.<br />
Q17. Why don't the individual pieces of my combo sum back to the combo total when I include<br />
custom and standard UEs in the combo?<br />
A17. When you include both custom and standard breaks in a combo, UEs are computed and are then<br />
used to create the total - even if standard UEs are available. You should be able to verify by<br />
summing the Daily Installed or Intab counts back to the combo total installed or intab counts.<br />
The <strong>National</strong> <strong>TV</strong> <strong>Toolbox</strong> Workspace • 2-26<br />
<strong>National</strong> <strong>TV</strong> <strong>Toolbox</strong> <strong>User</strong> <strong>Guide</strong>
Q18. Why are NPOWER's AA projections different from Galaxy ® Explorer projections?<br />
A18. NPOWER uses elemental calculation methodology; whereas, Galaxy Explorer uses a building block<br />
calculation methodology. This can cause subtle differences in the results.<br />
In addition, there is a product notice available in Product Notifications that contains additional<br />
information regarding the differences between Building Block and Elemental Methodologies.<br />
Q19. Why are multi-segment programs (broadcast complex and syndication AT ) reported<br />
differently when commercial data is selected?<br />
A19. With the NPOWER 4.4 release, with commercial or advertisement data selected, the following<br />
changes were made to multi-segment programs:<br />
For minute-level program ratings analysis reports, the commercial/promotional time is not included<br />
in the report output.<br />
Note Commercial and promotional duration is included for syndicated AT programs if the<br />
Syndicated AT Segments option under the Minute level report segment is selected. These individual<br />
segments are suppressed at the total program level. The NCCM duration is based on the lowest<br />
duration of the individual segments and is then compiled for the telecast.<br />
For R&F Program Schedules, if Commercial Minutes With At Least X Seconds (or its dependents) is<br />
selected, the units are at the individual segment level and multiple units for the same telecast are<br />
displayed. This can influence the frequency and GRP on R&F reports.<br />
For the R&F Advertisement Schedules, the units are at the individual segment level and multiple<br />
units for the same telecast are displayed. This can influence the frequency and GRP on R&F<br />
reports.<br />
Program Co-Viewing<br />
Q1. Why is the label on the Co-Viewing reports GAA%?<br />
A1. Co-Viewing reports have always been based on set-level GAA viewing. Since it is not a multiprocessed<br />
rating, it is labeled GAA.<br />
LOT/LOV<br />
Q1. What is the difference between a Length of Tune (LOT) and a Length of View (LOV)?<br />
A1. Overall, they are very similar reports; however, they are based on different data sets. The Length of<br />
Tune is based on time-period tuner/set-level data, which is set specific; the Length of View is based<br />
on program non-tuner/set level data, which combines the same instances from multiple sets into<br />
one instance.<br />
Ratings Analysis Reports<br />
Q1. Can I create a strict daypart for a Program Ratings Report?<br />
A1. No. Custom dayparts allow you to define any daypart; however, there is no option for strict dayparts.<br />
Q2. Why isn't the custom daypart I created listed on the Programs page under Custom Dayparts?<br />
A2. To successfully create and save a custom daypart, you must:<br />
1. From the Programs page, click Custom Dayparts. The Custom Program Daypart Groups popup<br />
window appears.<br />
2. From the Select Dayparts panel, make selections as desired.<br />
3. Click Add to add the daypart to the Current Selections list.<br />
<strong>National</strong> <strong>TV</strong> <strong>Toolbox</strong> <strong>User</strong> <strong>Guide</strong> The <strong>National</strong> <strong>TV</strong> <strong>Toolbox</strong> Workspace • 2-27
4. Highlight the daypart in the Current Selections list, and then click New Group.<br />
5. Enter a descriptive name for the group, and then click OK.<br />
6. Close the Program Dayparts pop-up.<br />
The new daypart is now listed in the Custom Dayparts box on the Programs page and can be<br />
selected when building a report specification.<br />
Q3. What happens when I select CVG AA % on the Statistics page and also select a custom<br />
coverage area?<br />
A3. The output ignores any Custom Coverage Areas selections when the CVG AA % statistic is<br />
selected. This will be noted on the boilerplate of your report output. If a user needs both Coverage<br />
Area methodologies, then two requests are required with the Custom Coverage Area run with the<br />
CVG AA % statistic removed.<br />
Q4. What is the difference between primary coverage area and custom coverage area?<br />
A4. A primary coverage area is processed like other <strong>Nielsen</strong> products. Custom coverage area uses a<br />
custom sample cutback method that is processed differently; therefore, the results are different from<br />
the primary coverage area. Please see the additional document available in online Help under the<br />
Reference section.<br />
Q5. What are the defaults on the Ratings Analysis Program Report Statistics page for <strong>National</strong><br />
Commercial Statistics?<br />
A5. NPOWER has the ability to provide <strong>National</strong> Commercial Statistics with more detail. NPOWER's<br />
defaults are preset to match the Commercial MIT default selections.<br />
Q6. How do you get a genre average rating?<br />
A6. With the Program Selection report segment, everything that is listed under one Program Selection<br />
folder in the Current Selections list on the Programs page will be rolled into one. For example, if you<br />
select Cable as an Originator Type and Situation Comedy as a Program Type, and then click Add<br />
on the Programs page, one Program Selection folder is added to your Current Selections list. Then,<br />
if you select Program Selection as a report segment and submit the request, you will receive a<br />
rolled up AA Rating for Cable Situation Comedy on your report output.<br />
Tip Double-click the Program Selection folder in the Current Selections list and rename it to<br />
identify the contents. This will help when reviewing the output.<br />
Q7. Why aren't my Coverage Area projections and Total U.S. projections the same or equal?<br />
A7. Different methodologies are used in the computations. See Coverage Areas Calculations in the<br />
Reference section of the online Help.<br />
Q8. How do I know what the data availability start dates are for time-shifted viewing?<br />
A8. Please refer to the Playback Period and Media Source page in the online Help.<br />
Q9. Why are some of my rows in the projection column blank?<br />
A9. NPOWER does not produce projections from a custom universe estimate by default. The UE Type<br />
is the last column on the report output. If the UE Type is C, it is a custom universe estimate. All<br />
standard universe estimates (UE Type = S) produce projection statistics. This process is applicable<br />
to the Ratings Analysis and Reach & Frequency / Duplication Reports. To allow custom U.S.<br />
projections in your request, users should go to the Statistics page and activate the option to display<br />
custom projections or modify Preferences.<br />
Q10. When is data such as Live+3 available for use with the playback period selections?<br />
A10. All playback data outside of Live+SD is delivered with the Live+7 viewing. For example, Live+3 data<br />
is not available until the Live+7 viewing for the week is loaded. Also, please refer to the data<br />
availability dates on the Playback Period and Media Source page. See Data Delivery Schedule.<br />
The <strong>National</strong> <strong>TV</strong> <strong>Toolbox</strong> Workspace • 2-28<br />
<strong>National</strong> <strong>TV</strong> <strong>Toolbox</strong> <strong>User</strong> <strong>Guide</strong>
Q11. On the Playback Period and Media Source page, why do the labels for the standard playback<br />
periods have an additional 3 hours in the parentheses, for instance, Live+3 Days (+75<br />
Hours)?<br />
A11. The Industry set the parameters for C3: C3 is truly the DVR playback that occurs after the live airing<br />
within 75 hours. The industry chose this because most DVR's telecasts are the prime time telecasts<br />
and most DVR playback occurs during the prime time daypart.<br />
For example, in order for an 8:00 p.m. telecast to credit to C3, it must be played back by 11:00 p.m.<br />
the third day, rather than the 24-hour day which would require it to be played back by 8:00 p.m. the<br />
third day.<br />
Note C3 is an ACM ratings estimate based on the average of all commercial minutes in a given<br />
program, including three days of DVR playback. Commercial minutes are identified using a<br />
combination of Monitor-Plus pattern recognition technology, program provider logs and content<br />
video.<br />
<strong>National</strong> Commercial Statistics<br />
Q1. What are the defaults on the Ratings Analysis Program Report Statistics page for <strong>National</strong><br />
Commercial Statistics?<br />
A1. NPOWER now has the ability to provide <strong>National</strong> Commercial Statistics with more detail.<br />
NPOWER's defaults are preset to match the Commercial MIT default selections.<br />
Q2. On my MxM output, why do zeros display in the national commercial duration and promo<br />
duration columns?<br />
A2. Zeros are reported when national commercial and promotional data is not yet available. Refer to<br />
Data Availability on the Measurement Interval page to find out what advertisement data is currently<br />
available.<br />
Q3. How do I manually calculate the AA% (NCCM Duration Weighted) that now displays on<br />
output for Program Selection, Originator, and Program report segments?<br />
A3. This calculation can only be recalculated at the Telecast report segment level. This calculation is<br />
fully explained in NPOWER training material. Please refer to the Reference section of the online<br />
Help for further information or contact your <strong>Nielsen</strong> Client Services representative.<br />
Q4. Are the <strong>National</strong> Commercial Clock Minutes (NCCM) Statistics VCR Adjusted?<br />
A4. Yes, they do include VCR Adjustment in a Ratings Analysis Program Report for the live viewing<br />
occurrences.<br />
Q5. How has the NCCM Index changed?<br />
A5. With the NPOWER 4.2 release on October 30, 2006, the NCCM Index calculation was changed:<br />
Telecast level program and average commercial minute (NCCM) ratings will be weight-averaged to<br />
the program, daypart, and originator levels by the number of commercial seconds contained in each<br />
telecast.<br />
<strong>National</strong> <strong>TV</strong> <strong>Toolbox</strong> <strong>User</strong> <strong>Guide</strong> The <strong>National</strong> <strong>TV</strong> <strong>Toolbox</strong> Workspace • 2-29
Q6. How do I manually calculate C3 VPVH and/or VPMH?<br />
A6.<br />
Q7. How do I calculate a primary coverage area commercial rating?<br />
A7. Make the following selections on the Statistics page:<br />
- CVG AA%<br />
- Projection<br />
- <strong>National</strong> Commercial Statistics<br />
For standard universe estimates, calculate the primary Coverage Area NCCM AA% from the report<br />
results using this formula:<br />
CVG NCCM AA% = (Total US NCCM Proj / CVG UE ) * 100<br />
Q8. What statistic should be used to evaluate Average Commercial Minute audience data for<br />
syndication (AT) programs?<br />
A8. Many syndicated programs are sold with Additional Telecasts (ATs) incorporated into a single<br />
program audience estimate. This means that multiple episodes of the same program, each<br />
containing identical national commercial loads, air during the same week. These programs are<br />
bought and sold on a Gross Average Audience (GAA) basis. The national commercial inventory in<br />
these different episodes commonly occurs at slightly different times. Accordingly, to properly<br />
produce Average Commercial Minute estimates for these programs, Monitor-Plus needed to monitor<br />
the feed for each component episode individually in order to identify the actual commercial minutes<br />
in each episode.<br />
As these programs are bought and sold based on GAA estimates; the evaluation of Average<br />
Commercial Minute audiences should also be based on GAA estimates. Comparing the AA% and<br />
AA (000) program and Average Commercial Minute estimates for syndicated programs with ATs will<br />
result in illogical ratios or indices.<br />
The illogical ratios result from the fact that the total program AA% estimates for these syndicated AT<br />
programs are 'multiprocessed'. This means that viewing to the same 'Minute of Program'(MOP) in<br />
multiple component episodes is only counted once. However, in a commercial minute environment<br />
the commercial breaks in these different episodes occur at different times (in different MOPs).<br />
Viewing to commercial minutes in multiple component episodes is only 'multiprocessed' in those<br />
situations where commercial minutes align to same MOP. For this reason, viewing to commercial<br />
minutes is not 'multiprocessed' in equal proportion to the whole program.<br />
Example: Minutes of Program (commercial minutes)<br />
Episode 1: 1 2 3 4 (5 6 7) 8 9 10 11 12 13 14 (15 16 17) 18 19 20<br />
Episode 2: 1 2 3 4 5 6 (7 8 9) 10 11 12 13 14 15 (16 17 18) 19 20<br />
If a person viewed all 20 minutes of the above two component episodes of a syndicated AT<br />
program, the ratios of program minutes viewed to commercial minutes viewed would be as follows<br />
on both an AA% and GAA% basis:<br />
AA Basis:<br />
20 of 20 Program Minutes = 100% Program AA Rating<br />
9 of 6 Commercial Minutes = 150% Commercial Minute AA Rating<br />
Commercial to Program Min Index = 150 ((150/100)*100)<br />
The <strong>National</strong> <strong>TV</strong> <strong>Toolbox</strong> Workspace • 2-30<br />
<strong>National</strong> <strong>TV</strong> <strong>Toolbox</strong> <strong>User</strong> <strong>Guide</strong>
GAA Basis:<br />
40 of 40 Program Minutes = 100% Program GAA Rating<br />
12 of 12 Commercial Minutes = 100% Commercial Minute GAA Rating<br />
Commercial to Program Min Index = 100 ((100/100)*100<br />
Reach & Frequency<br />
Q1. How do I run a Progressive Cume report?<br />
A1. Progressive Cume is included as an option on the Statistics page for R&F reports.<br />
Note Progressive Cume requires Schedule Detail as a report segment.<br />
Q2. How do I run an Only Only Both (OOB) report?<br />
A2. The Only Only Both report is included in the R&F Duplication Report.<br />
Q3. What happens when the measurement interval for unification does not match the<br />
measurement interval of the viewing within the schedules?<br />
A3. NPOWER uses the UEs in the unification regardless of the viewing period being analyzed in the<br />
schedule.<br />
Q4. Why are my units not the same as the commercial log from Ad*Views?<br />
A4. By default, if the specs were created the same, they should be equal with the exception of SYN(AT)<br />
Programs and Broadcast Complex Programs. All other inconsistencies should be reported to your<br />
<strong>Nielsen</strong> Customer Service Representative.<br />
Q5. How do I compare program and/or time-period data prior to February 2011 to current data?<br />
A5. There are two options:<br />
a) To report unique viewers only:<br />
- Process the pre-February 2011 data using the AA Reach Type.<br />
- Process the post-February 2011 data using the AA Reach Type with the "Apply Distinct<br />
Processing" option selected for program or time-period schedules.<br />
b) To report all viewing (duplicates):<br />
- Process the pre-February 2011 data using the GAA Reach Type with the "Allow Non-Ordered<br />
GAA" option selected.<br />
- Process the post-February 2011 data using the AA Reach Type without the "Apply Distinct<br />
Processing" option selected.<br />
Q6. For current data, can I compare non-multiprocessed (duplicate) to multiprocessed data<br />
(unique)?<br />
A6. Yes, however, after creating the unifications and schedules you want to use, it requires two reports:<br />
a) A R&F Report without the "Apply Distinct Processing" option selected. This report will include the<br />
duplicate viewers in the Average Frequency/Average Minute metrics.<br />
b) Then edit that report and select the "Apply Distinct Processing" option. This report will exclude all<br />
duplicate viewing and will align to the old multiprocessed methodology. The Reach in each report<br />
should be the same.<br />
Q7. Why were the Reach & Frequency enhancements made?<br />
A7. They are an adjustment to the duplicate audience incorporated into the AA calculation in February<br />
2011, which was made to better capture multiple viewings of programs in <strong>TV</strong> homes.<br />
<strong>National</strong> <strong>TV</strong> <strong>Toolbox</strong> <strong>User</strong> <strong>Guide</strong> The <strong>National</strong> <strong>TV</strong> <strong>Toolbox</strong> Workspace • 2-31
Q8. Are there additional details for how the new option to process Average Frequency and<br />
Average Minutes excluding duplicate viewing will work?<br />
A8. While the default methodology for NPOWER's Average Frequency and Average Minutes<br />
calculations will continue to include any duplicate viewing, an "Apply Distinct Processing" option<br />
was added to the Statistics page. If selected, Average Frequency, Average Minutes, and their<br />
dependent statistics will exclude duplicate viewing. By selecting this option, users who do<br />
programming research will now be able to analyze how many different episodes of a series a viewer<br />
watched. Qualified audience schedules submitted with this option selected will trend with historical<br />
multiprocessed data for periods prior to the duplicate viewing calculation changes made in February<br />
2011. Using this option, the highest possible frequency is 1 per telecast.<br />
• Advertisement schedules should always be evaluated using the default frequency methodology, which<br />
counts any repeat viewing of commercial minutes. For program or time-period schedules, the<br />
NPOWER user will be able to choose to evaluate their frequency differently, depending on the<br />
purpose of their analysis.<br />
• Frequency-based statistics include: Qualified GRP % / (000) and Frequency Distribution if selected.<br />
• Average minute-based statistics include: Spot GRP % / (000).<br />
As noted above, although the Spot GRP% / (000) changes, if this option is selected, advertisement<br />
schedules are always evaluated with the default methodology.<br />
Q9. Was any impact data provided with this change?<br />
A9. Yes. Contact your <strong>Nielsen</strong> Client Service Representative for supporting analyses.<br />
Q10. Was there an effect on C3 or Program MIT files, local reporting, or local data files?<br />
A10. No. This change is limited to qualified program and time-period frequency data within NPOWER's<br />
Reach & Frequency Reports.<br />
Q11. Is NPOWER data for Local People Meter Markets affected?<br />
A11. Some clients have access to Reach & Frequency data for Local People Meter markets and samples<br />
from NPOWER. NPOWER time-period frequency data, reported within Local People Meter markets,<br />
will also benefit from the calculation enhancements. NPOWER does not report program data for<br />
Local People Meter markets.<br />
Q12. How do I analyze unique episodes across an interval/season?<br />
A12. Prior to February 2011, the default AA methodology was multiprocessed and excluded all duplicate<br />
viewing. Processing with the AA Reach Type for historical data provides this type of analysis. For<br />
data beginning February 2011, to perform this analysis you should run the AA Reach Type with the<br />
"Apply Distinct Processing" option selected. This will exclude any duplicate viewing and will align<br />
with the old multiprocessed methodology.<br />
Segmentation Reports<br />
Q1. What is the difference between Total, Average, and Percent of Minutes as report options on<br />
Segmentation reports?<br />
A1. Total Minutes = based on a respondent's absolute total minutes viewed. If that number is greater<br />
than or equal to the qualifier, then that person would qualify for the appropriate audience segment.<br />
Average Minutes = based on a respondent's total number of minutes viewed divided by the<br />
number of telecast or viewing intab days. If the respondent's value is greater than or equal to the<br />
qualifier, then that person would qualify for the appropriate audience segment<br />
Percentage of Minutes = based on a respondent's total number of minutes viewed divided by the<br />
number of minutes the respondent had the opportunity to view. If the respondent's value is greater<br />
than or equal to the qualifier, then that person would qualify for the appropriate audience segment.<br />
The <strong>National</strong> <strong>TV</strong> <strong>Toolbox</strong> Workspace • 2-32<br />
<strong>National</strong> <strong>TV</strong> <strong>Toolbox</strong> <strong>User</strong> <strong>Guide</strong>
Q2. When I go to run a segmentation in another report, why are some of my segmentation breaks<br />
in the segmentation characteristic tab missing?<br />
A2. Some of your segmentation breaks contained no viewers; therefore, they do not appear on the<br />
Segmentation Characteristics tab.<br />
Q3. How do I run a Share of Viewing report?<br />
A3. Share of Viewing is an optional statistic in ratings reports: Sum of Sources Viewing Distribution %<br />
(SOV).<br />
Q4. What happens when I run an NTile that does not have enough viewers?<br />
A4. Segments with zero viewers are not displayed on the Segmentation Characteristics tab.<br />
Source & Destination Reports<br />
Q1. Why doesn't my Source & Destination Target Set AA% rating match a minute-level ratings<br />
analysis for the same data?<br />
A1. Overall, they are very similar statistics; however, they are based on different data sets. The Source<br />
& Destination reports are based on tuner/set-level data, whereas, Ratings Analysis reports are<br />
based on non-tuner/set level data. In addition, there are processing differences with visitor viewing<br />
and VCR adjustment between the two reports.<br />
Q2. Why can't I select a primary feed pattern in the Source & Destination reports?<br />
A2. Since the entire report is based on the selected feed pattern, primary feed pattern is not applicable.<br />
Extended Screen<br />
Q1. Which reports include the computer-based viewing for Extended Screen in the <strong>National</strong> and<br />
Hispanic samples?<br />
A1. The program-based Ratings Analysis and PowerPlay reports will default to include the computerbased<br />
viewing in their audience estimates. However, you can optionally analyze the <strong>TV</strong> or PC<br />
contributions under the Media Source.<br />
Q2. Is computer-based viewing available for time period data?<br />
A2. No, it currently only available for the non-tuner/set-level program reports.<br />
Q3. Why does NPOWER now have access to the Cross-Platform Panel sample for <strong>TV</strong> data?<br />
A3. To evaluate reach and frequency including the computer-based viewing. Please see the Cross-<br />
Platform Panel section of online Help for additional information.<br />
<strong>National</strong> <strong>TV</strong> <strong>Toolbox</strong> <strong>User</strong> <strong>Guide</strong> The <strong>National</strong> <strong>TV</strong> <strong>Toolbox</strong> Workspace • 2-33
MarketBreaks<br />
This section provides MarketBreaks overview and reference information.<br />
About <strong>Nielsen</strong> MarketBreaks<br />
MarketBreaks is a web-based tool that lets you create reports based on standard market breaks and<br />
demographics from data supplied by The <strong>Nielsen</strong> Company. There are two samples available: Hispanic and<br />
<strong>National</strong>.<br />
Access to MarketBreaks ® is available based on your contract. For more information, contact your <strong>Nielsen</strong><br />
Client Service Representative. You may also contact the <strong>Nielsen</strong> Solutions Center at 1.800.423.4511 or e-<br />
mail prodhelpline@nielsen.com.<br />
MarketBreaks allows you to analyze national viewing data for broadcast networks, syndicators, and cable<br />
networks.<br />
The MarketBreaks application provides a step-by-step wizard to help you create specifications, or you can<br />
exit the wizard and make selections manually at any time.<br />
MarketBreaks Key Features<br />
• Analyze <strong>Nielsen</strong> national viewing data for broadcast networks, syndicators, and cable networks.<br />
• Create analyses based on specific target audiences and competitors, using combinations or subsets<br />
of data in addition to those in the standard published <strong>Nielsen</strong> reports.<br />
• Accesses data for the <strong>National</strong> People Meter (<strong>National</strong>) sample and the <strong>National</strong> People Meter<br />
Hispanic (Hispanic) sample through browser-based analysis applications.<br />
• Enhanced usability.<br />
• Fast and consistent processing time.<br />
• Boolean logic (AND, OR, NOT logic) is available for market breaks, custom coverage areas, and<br />
viewing sources.<br />
• Ability to average across larger measurement intervals.<br />
• View report results in Microsoft Excel format.<br />
MarketBreaks provides the following report types:<br />
• Ratings Analysis<br />
• Trend Analysis Program Builder/Trend Analysis Time Period Builder<br />
• Universe Estimate<br />
Software Upgrades<br />
Because MarketBreaks is a browser-based application, the software resides on the <strong>Nielsen</strong> server. Software<br />
updates are rolled out on predefined dates without requiring any action on your part.<br />
Additional Information<br />
<strong>Nielsen</strong> U provides a variety of online educational options including interactive online tutorials, synchronous<br />
classes (real-time, instructor-led classes delivered over the Internet using two-way audio and application<br />
sharing), and registration for traditional classroom classes. MarketBreaks training, in any form, teaches you<br />
how to make the most of the product capabilities and get the best results.<br />
Tip <strong>Nielsen</strong> U is available at answers.nielsen.com. Use the Help & Learn menu to open the Help & Learn<br />
Main Page, which provides access to <strong>Nielsen</strong> U.<br />
The <strong>National</strong> <strong>TV</strong> <strong>Toolbox</strong> Workspace • 2-34<br />
<strong>National</strong> <strong>TV</strong> <strong>Toolbox</strong> <strong>User</strong> <strong>Guide</strong>
<strong>Nielsen</strong> MarketBreaks Reports<br />
<strong>Nielsen</strong> MarketBreaks reports allow you to analyze national viewing data for broadcast networks, syndicators,<br />
and cable networks.<br />
Ratings Analysis<br />
These are standard program and time period reports, which also offer the added option to produce timeshifted<br />
viewing analyses.<br />
Note To further analyze time-shifted viewing (TSV), select a playback period from the Playback Period and<br />
Media Source selection tab.<br />
• Ratings Analysis Program Report - allows you to produce individual ratings reports based on<br />
program data and dayparts, and allows you to analyze national commercial clock minute data. Primary<br />
averaging intervals include program selection, originator, program, program trackage, program<br />
episode, and telecast. Additional averaging levels are also available. Program reports are run for<br />
broadcast, cable, and syndication programs in their entirety.<br />
• Ratings Analysis Time Period Report - allows you to produce individual minute ratings reports<br />
based on time period data. Averaging levels include total daypart or daypart. Time period reports are<br />
useful for obtaining data for those broadcast or cable originators who do not supply The <strong>Nielsen</strong><br />
Company with program lineups. Time period reports are sorted according to time slots and do not take<br />
program or length of program into consideration.<br />
Trend Ratings Analysis - provides a two-phased approach to building and analyzing a large volume of<br />
program data and time period requests.<br />
Phase 1:<br />
• Trend Analysis Program Builder/Trend Analysis Time Period Builder - allows users to create<br />
customized data sets containing multiple Originators/Viewing Sources, Demographics and<br />
MarketBreaks for large measurement intervals. By utilizing the scheduler, reports are submitted once<br />
but extracted daily and compiled together for reporting in either Trend Analysis Program Report/Trend<br />
Analysis Time Period Report<br />
Phase 2:<br />
• Trend Analysis Program Report/Trend Analysis Time Period Report - allows users to perform<br />
data analyses based on the specifications compiled and requested within the Trend Builder reports.<br />
Universe Estimate<br />
UE and Sample Information - allows you to examine the sample sizes and weighted universe estimates for<br />
the dates, demographics, and market breaks selected.<br />
<strong>National</strong> <strong>TV</strong> <strong>Toolbox</strong> <strong>User</strong> <strong>Guide</strong> The <strong>National</strong> <strong>TV</strong> <strong>Toolbox</strong> Workspace • 2-35
Market Breaks Frequently Asked Questions<br />
Market Breaks frequently asked questions and answers are provided for reference purposes.<br />
General<br />
Q1. What are the operating hours for MarketBreaks?<br />
A1. Monday-Friday 8 a.m.-12 a.m. Eastern time.<br />
Q2. When is MarketBreaks data released?<br />
A2. MarketBreaks data is released next next day at 8 a.m. ET. For example, Monday data is delivered<br />
on Wednesday at 8 a.m. ET.<br />
Q3. What preferences can I set, and how can I set them?<br />
A3. The following preferences can be set from the Option menu on the <strong>National</strong> <strong>TV</strong> <strong>Toolbox</strong> home page:<br />
- E-mail Notifications: Yes or No<br />
- Open Folders: Yes or No<br />
- Display Custom PROJ: Yes or No<br />
- Exclude Sample Info: Yes or No<br />
- Calendar Service: NTI, NHI, NSS or BCST<br />
- Format Excel: Yes or No<br />
- CSV Output: Yes or No<br />
- Apply Distinct Processing: Yes or No<br />
Q4. What types of reports are available in MarketBreaks?<br />
A4. The following reports are available in MarketBreaks:<br />
- Ratings Analysis<br />
- Trend Ratings Analysis<br />
- Universe Estimates<br />
Q5. Where will my job specifications and output reside?<br />
A5. Report specifications and output are listed on the "Job Specifications" and "Jobs" tabs of the home<br />
page, respectively.<br />
Q6. How do I determine the status of my submitted jobs?<br />
A6. The "Jobs" tab on the Home page lists all submitted requests and provides the following details:<br />
- Report Name - user defined<br />
- Status - the status of your submitted job (See online Help for status definitions)<br />
- Submitted - date/time job was submitted<br />
- Completed - date/time job was completed<br />
- Report Output - Excel or Zip formats<br />
Q7. Why aren't all my statistics available in the Builder job?<br />
A7. The builder job only contains a subset of the statistics you can report on. When you are running a<br />
Trend Analysis report, additional statistics will be available to report on.<br />
Q8. Do I need to wait for the entire measurement interval within my Trend Builder to complete<br />
prior to analyzing?<br />
A8. No. You can begin to analyze data within your Trend Builder while the Builder report is running.<br />
The <strong>National</strong> <strong>TV</strong> <strong>Toolbox</strong> Workspace • 2-36<br />
<strong>National</strong> <strong>TV</strong> <strong>Toolbox</strong> <strong>User</strong> <strong>Guide</strong>
Q9. How can I see the contents of a folder?<br />
A9. Click the arrow to the left of a folder name to open the folder. Click the arrow again to close the<br />
folder.<br />
You can specify the default setting for folders to be open, if desired.<br />
Note From the home page menu, click Options, and then click Preferences.<br />
Q10. How does the Cross command differ from the Combine command?<br />
A10. Cross - When you use the Cross command, combos are created automatically from within the<br />
Current Selections list. When you right-click the primary criteria and select Cross, each criteria in<br />
the list is crossed with the primary criteria. The resulting combos created are in an AND relationship.<br />
Note Use the Cross Selected command to cross only highlighted criteria.<br />
Combine - When you use the Combine command, you must manually highlight the criteria you<br />
want to combine for each combo, apply the Combine command, and then name each combo. The<br />
default relationship for combos is an OR relationship.<br />
Q11. How can I share my report specifications and report executions?<br />
A11. When saving or submitting report specifications, click the Shared? box on the Specification<br />
Definition page. To remove Report Specifications or Report Executions from the shared folder, open<br />
the report, click the Shared? box again to clear the selection, and then save once again.<br />
Q12. Can I share groups?<br />
A12. No. Your groups exist only on your ID; however, you can share a report you created, allowing other<br />
NPOWER users within your business entity to open your report and save its contents as groups on<br />
their own IDs.<br />
Q13. What do the error messages on the Specification Definition page mean?<br />
A13. This report name already exists.<br />
You cannot save a report with the same name as one that already exists. This is to avoid<br />
overwriting existing Report Specifications. Please rename and save again.<br />
This spec exceeds allotted processing time.<br />
A flexible algorithm is applied to all specs when submitted in order to approximate report run time<br />
and prevent very long processing and queue times. This error message appears if you have<br />
selected a combination of telecasts, MOPs, statistics, market breaks, demos, viewing sources, and<br />
custom coverage areas that exceed the formula. If you receive this message, please reduce the<br />
number of selections in your report specification and submit it again.<br />
This spec exceeds memory limitations.<br />
Prior to run time, all specs are reviewed to determine the number of internal rows of data that will be<br />
generated. Even though Excel allows for 64,000 rows of data, we have a memory limitation of<br />
20,000 internal rows when processing reports. This limitation is typically reached when a user<br />
selects a large number of telecasts or MOPs to include in a report. If you receive this message,<br />
please cut back your report specs and submit again.<br />
The system failed to process your request at this time.<br />
The report specification has an invalid selection, or a value has been changed.<br />
This spec exceeds the allocations limit.<br />
This error message appears if the report results exceed a pre-determined allocation limit. If you<br />
receive this message, please reduce the number of selections in your report specification and<br />
submit again.<br />
This spec exceeds the schedule limit.<br />
<strong>National</strong> <strong>TV</strong> <strong>Toolbox</strong> <strong>User</strong> <strong>Guide</strong> The <strong>National</strong> <strong>TV</strong> <strong>Toolbox</strong> Workspace • 2-37
This error message appears if the report results exceed a pre-determined schedule limit. If you<br />
receive this message, please reduce the number of selections in your report specification and<br />
submit again.<br />
Q14. How can I print report specifications?<br />
A14. Click the Print Specification icon in the top, right corner of the Specification Definition page.<br />
Note The latest version of Adobe Reader is required. For more information, see System<br />
Requirements.<br />
Q15. Why didn't I get any data back in my report?<br />
A15. Most likely, you selected a measurement interval that is not yet available or does not correlate to the<br />
interval selected in the builder report. Check the Data Availability tab on the Measurement Interval<br />
page or the dates selected in your Trend Analysis Builder job.<br />
Q16. How do I know what data is available?<br />
A16. Check the Data Availability tab on the Measurement Interval page or check the Data Delivery<br />
Schedule in Help. MarketBreaks has data back to 08/27/01 going forward.<br />
Q17. How can I schedule a report based on broadcast weekly data?<br />
A17. Each of the data releases included on the Data Availability tab can be selected from the drop-down<br />
list in the Schedule Report section of the Measurement Interval page once a recurring interval is<br />
selected. This includes each of the time-shifted viewing types and the Broadcast Weekly data<br />
release.<br />
Q18. Can I create a strict daypart for a Program Ratings Report?<br />
A18. No. Custom dayparts allow you to define any daypart; however, there is no option for strict dayparts.<br />
Q19. Why isn't the custom daypart I created listed on the Programs page under Custom Dayparts?<br />
A19. To successfully create and save a custom daypart, see the Creating Custom Dayparts topic.<br />
Q20. How do you get a genre average rating?<br />
A20. With the new Program Selection report segment, everything that is listed under one Program<br />
Selection folder in the Current Selections list on the Programs page will be rolled into one rating. For<br />
example, if you select Cable as an Originator Type and Situation Comedy as a Program Type, and<br />
then click Add on the Programs page, one Program Selection folder is added to your Current<br />
Selections list. Then, if you select Program Selection as a report segment and submit the request,<br />
you will receive a rolled up AA Rating for Cable Situation Comedy on your report output.<br />
Tip Double-click the Program Selection folder in the Current Selections list and rename it to<br />
identify the contents. This will help when reviewing the output.<br />
Q21. How do I know what the data availability start dates are for time-shifted viewing?<br />
A21. Please refer to the Playback Period and Media Source page.<br />
Q22. What is the difference between Program and Time Period daypart?<br />
A22. In MarketBreaks, all program data are based on total program. When you select a daypart on the<br />
Program Filters page, you get all programs with a start time that falls in that daypart. For example, if<br />
you select M-S 8:00 p.m. and 9:00 p.m. you get the total program data for all programs that started<br />
between 8:00 p.m. and 9:00 p.m. Program data are available for Cable, Broadcast, and Syndication.<br />
(Please note that program dayparts do not apply to syndicated programs.) A time-period daypart<br />
gives you the data for the precise start and end times for the viewing source or usage you select.<br />
Time-period data is available for a variety of network types and HUT/PUT.<br />
Q23. How do I access online Help to find answers to my questions?<br />
A23. To view the Help for the specific page you are on, click the Help button at the top of the page, and<br />
then select Current Page Help. Current Page Help describes each field on the page and provides<br />
related links that explain how to use it.<br />
The <strong>National</strong> <strong>TV</strong> <strong>Toolbox</strong> Workspace • 2-38<br />
<strong>National</strong> <strong>TV</strong> <strong>Toolbox</strong> <strong>User</strong> <strong>Guide</strong>
Q24. Where will "Time Period Only" networks reside?<br />
A24. Time period only networks will reside in the External Non-Dailies viewing source bucket. Networks<br />
in this category can only be run for intervals of a week or more.<br />
Q25. How long will my Job Specifications and Jobs reside on my ID?<br />
A25. All Job Specifications will be available for 15 months. Specifications that have not been used in 15<br />
months will be marked for deletion. Jobs (executions) will always roll off at 30 days; however,<br />
certain report types are retained longer.<br />
Q26. How do I manually calculate C3 VPVH and/or VPMH?<br />
A26.<br />
Q27. Which reports include the computer-based viewing for Extended Screen?<br />
A27. The program-based Ratings Analysis and Trend Builder and Reports will automatically include the<br />
computer-based viewing in their audience estimates.<br />
<strong>National</strong> <strong>TV</strong> <strong>Toolbox</strong> <strong>User</strong> <strong>Guide</strong> The <strong>National</strong> <strong>TV</strong> <strong>Toolbox</strong> Workspace • 2-39
SSG<br />
This section provides SSG overview information.<br />
About SSG<br />
Sample Statistic Generator (SSG) is a web-based application offered by The <strong>Nielsen</strong> Company that provides<br />
clients the ability to generate universe estimate and sample statistic information based on user-defined<br />
criteria.<br />
Using SSG, you can retrieve information at various levels: total sample, cable coverage area, market break,<br />
household, and demographics.<br />
The September 1, 2003 weighting implementation of both the <strong>National</strong> and Hispanic samples introduced the<br />
following additional standard error statistics: Proportionate Equivalent Sample Size (PESS) and Weighting<br />
Effect on Standard Error (WESE).<br />
Due to the increase in geographical representation recognized by the integration of full local people meter<br />
markets into the <strong>National</strong> sample, new sample statistics are available with data effective January 26, 2004.<br />
These sample statistics, scaled install and scaled intab counts, only apply to the <strong>National</strong> sample.<br />
Notes<br />
• SSG data is currently available from August 26, 2002 forward.<br />
• Reports with no activity remain on the server 30 days for downloading.<br />
• As of September 2007, PESS and WESE are available for the Hispanic sample or sub sample.<br />
The <strong>National</strong> <strong>TV</strong> <strong>Toolbox</strong> Workspace • 2-40<br />
<strong>National</strong> <strong>TV</strong> <strong>Toolbox</strong> <strong>User</strong> <strong>Guide</strong>
Chapter 3<br />
<strong>National</strong> <strong>TV</strong> <strong>Toolbox</strong> Data<br />
This chapter provides data delivery schedules, shows how to find the dates for which data is available, and<br />
defines market break and demographic criteria selections available when creating your reports.<br />
■<br />
■<br />
■<br />
■<br />
■<br />
Displaying Data Availability<br />
Market Break Descriptions<br />
Demographic Descriptions<br />
About Universe Estimates<br />
Additional Subscriptions<br />
<strong>National</strong> <strong>TV</strong> <strong>Toolbox</strong> <strong>User</strong> <strong>Guide</strong> <strong>National</strong> <strong>TV</strong> <strong>Toolbox</strong> Data • 3-41
Displaying Data Availability<br />
Data availability can be displayed from the Measurement Interval page.<br />
1. From the Specification Definition page, click the Measurement Interval selection tab.<br />
2. From the Measurement Interval page, click Data Availability.<br />
3. Click Data Availability again to hide the legend.<br />
<strong>National</strong> <strong>TV</strong> <strong>Toolbox</strong> Data • 3-42<br />
<strong>National</strong> <strong>TV</strong> <strong>Toolbox</strong> <strong>User</strong> <strong>Guide</strong>
Market Break Descriptions<br />
The general viewing audience is identified by household characteristics referred to as market sections. These<br />
market sections are then broken down into specific characteristics referred to as market breaks.<br />
The following table provides a description of the market sections and market breaks included in <strong>Nielsen</strong><br />
NPOWER:<br />
Notes<br />
• Household information<br />
• No = Household does not meet requirement<br />
• Yes = Household meets the requirement<br />
• Un = Unknown or Unclassified<br />
• If the measurement interval selected for the specification is prior to the effective start date of a<br />
selected market break, a custom universe estimate is reported for that market break. See UE Types<br />
and Effective Dates<br />
Market Section Market Break Description<br />
Beverage Usage<br />
Cable Status<br />
Bottled Water = No<br />
Bottled Water = Un<br />
Bottled Water = Yes<br />
Coffee or Tea = No<br />
Coffee or Tea = Un<br />
Coffee or Tea = Yes<br />
Soft Drinks = No<br />
Soft Drinks = Un<br />
Soft Drinks = Yes<br />
Table Wine = No<br />
Table Wine = Un<br />
Table Wine = Yes<br />
Alt Delivery Without Pay or Wired<br />
Cable<br />
Any Cable<br />
Broadcast Only<br />
Indicates if a bottled water purchase<br />
was made by the household in the<br />
last three months.<br />
Indicates if a purchase of coffee or<br />
tea was made by the household in<br />
the last three months.<br />
Indicates if a purchase of soft drinks<br />
was made by the household in the<br />
last three months.<br />
Indicates if a purchase of table wine<br />
was made by the household in the<br />
last three months.<br />
Includes households that receive<br />
cable channels via MDS (multidistribution<br />
and wireless cable), DBS<br />
(direct broadcast satellite), Satellite,<br />
or Master Antenna. This break<br />
reports on cable receivability only.<br />
Pay service options are not<br />
included.<br />
Households that receive basic cable<br />
within households where the<br />
householder is of Hispanic origin.<br />
The household receives broadcast<br />
channels only, for example, not<br />
wired for cable, no alternate delivery<br />
sources, and therefore no pay<br />
channels<br />
<strong>National</strong> <strong>TV</strong> <strong>Toolbox</strong> <strong>User</strong> <strong>Guide</strong> <strong>National</strong> <strong>TV</strong> <strong>Toolbox</strong> Data • 3-43
Market Section Market Break Description<br />
Cable Plus NHTI = Cable Plus<br />
ADS = No<br />
ADS = Yes<br />
Cable Plus = No<br />
Cable Plus = Yes<br />
NHTI Cable Plus = Yes<br />
Cable Plus with Pay = No<br />
Cable Plus with Pay = Yes<br />
NHTI Cable Plus with Pay = No<br />
NHTI Cable Plus with Pay = Yes<br />
DBS = No<br />
DBS = Un<br />
DBS = Yes<br />
MDS = No<br />
MDS = Un<br />
MDS = Yes<br />
Pay Cable =No<br />
Pay Cable =Un<br />
Pay Cable = Yes<br />
SMA<strong>TV</strong> = No<br />
SMA<strong>TV</strong> = Un<br />
Based on a household's ability to<br />
receive cable channels via a wire to<br />
the home from a cable headend<br />
located in the community or via any<br />
other alternate delivery source such<br />
as C-Band Satellite Dish, Direct<br />
Broadcast Satellite (DBS) <strong>TV</strong><br />
systems, Wireless Cable, and so<br />
forth.<br />
The technology included in alternate<br />
delivery sources are satellite (Cband),<br />
DBS (KU-band), SMA<strong>TV</strong><br />
(master antennae), and MDS<br />
(includes multi-channel multi-point<br />
and multi-point distribution service).<br />
Based on a household's ability to<br />
receive cable channels via a wire to<br />
the home from a cable headend<br />
located in the community or via any<br />
other alternate delivery source such<br />
as C-Band Satellite Dish, Direct<br />
Broadcast Satellite (DBS) <strong>TV</strong><br />
systems, Wireless Cable, and so<br />
forth.<br />
The household receives cable<br />
through a local cable headend (for<br />
example, the home is "wired" for<br />
cable) or via some other form of<br />
alternate delivery AND the<br />
household receives pay channels for<br />
which the cable supplier normally<br />
charges an extra premium, for<br />
example, HBO, Showtime, Cinemax,<br />
and so forth.<br />
Indicates the ability to receive direct<br />
broadcast satellite signals.<br />
Indicates the ability to receive MDS.<br />
An additional monthly charge paid<br />
by a cable subscriber for any<br />
number of program services above<br />
the basic cable service.<br />
Indicates the presence of a master<br />
antenna.<br />
<strong>National</strong> <strong>TV</strong> <strong>Toolbox</strong> Data • 3-44<br />
<strong>National</strong> <strong>TV</strong> <strong>Toolbox</strong> <strong>User</strong> <strong>Guide</strong>
Market Section Market Break Description<br />
SMA<strong>TV</strong> = Yes<br />
Satellite = No<br />
Satellite = Un<br />
Satellite = Yes<br />
Wired Cable = No<br />
Wired Cable = Yes<br />
Wired Digital Cable = No<br />
Wired Digital Cable = Un<br />
Wired Digital Cable = Yes<br />
Wired Digital Cable with Pay = No<br />
Wired Digital Cable with Pay = Un<br />
Wired Digital Cable with Pay = Yes<br />
Wired Digital Cable without Pay =<br />
No<br />
Wired Digital Cable without Pay =<br />
Un<br />
Wired Digital Cable without Pay =<br />
Yes<br />
Indicates the ability to receive<br />
satellite signals from the larger,<br />
legacy satellite dishes.<br />
The household is wired for cable.<br />
For example, it receives cable via a<br />
wire to the home from a cable<br />
headend located in the community.<br />
If a home is "wired" to receive cable<br />
channels on any <strong>TV</strong> set in the home,<br />
then the home is considered a<br />
"wired" cable home.<br />
The household is equipped to<br />
receive digital cable.<br />
The household is equipped to<br />
receive digital cable AND the<br />
household receives pay channels,<br />
for example, HBO, Showtime,<br />
Cinemax, and so forth.<br />
The household is equipped to<br />
receive digital cable but does not<br />
receive pay channels, for example,<br />
HBO, Showtime, Cinemax, and so<br />
forth.<br />
Tip Analog = Wired Digital Cable - NO AND Wired Cable - YES<br />
College Student Away<br />
College Student Away = No<br />
College Student Away = Yes<br />
<strong>National</strong> households who have at<br />
least one household member that<br />
lives away while attending a higher<br />
education facility within the United<br />
States.<br />
Composite Composite The total number of television<br />
households within a coverage area.<br />
When reporting market breaks, the<br />
individual market breaks within a<br />
section that are mutually exclusive<br />
can sum to total composite. For<br />
example, within the market section<br />
of County Size, the market breaks of<br />
County Size A, County Size B,<br />
County Size C, and County Size D<br />
would sum to total composite.<br />
<strong>National</strong> <strong>TV</strong> <strong>Toolbox</strong> <strong>User</strong> <strong>Guide</strong> <strong>National</strong> <strong>TV</strong> <strong>Toolbox</strong> Data • 3-45
Market Section Market Break Description<br />
County Size<br />
A<br />
B<br />
C<br />
D<br />
NHTI C & D<br />
Based on the population and<br />
metropolitan location of the county in<br />
which the household is located.<br />
The four county size groups are<br />
defined as follows:<br />
• A - All counties belonging, as<br />
of June 30, 1999, to the<br />
largest metropolitan areas,<br />
which together account for<br />
40% of U.S. households<br />
according to the 2000<br />
Census.<br />
• B - All counties in the next<br />
largest set of metropolitan<br />
areas which together account<br />
for 30% of U.S. households.<br />
• C - All counties in the next<br />
largest set of areas -<br />
including both metropolitan<br />
areas and non-metropolitan<br />
counties, which account for<br />
15% of U.S. households.<br />
• D - All remaining counties.<br />
DMA Rank Rank 1-10<br />
Rank 11-25<br />
Rank 26-49<br />
Rank 50+<br />
The rank (based on number of <strong>TV</strong><br />
households) of the DMA (designated<br />
market area) to which the<br />
household's state/county is<br />
assigned.<br />
DVD Owner<br />
DVR Household<br />
Rank 100+<br />
No<br />
Un<br />
Yes<br />
DVR Household<br />
Non-DVR Household<br />
Based on whether the household<br />
has a digital video disk player.<br />
A household that has a device<br />
(Digital Video Recorder) that<br />
enables the user to watch, pause,<br />
playback, and/or record live<br />
television.<br />
HH Income
Market Section Market Break Description<br />
$50,000-59,999<br />
$60,000+<br />
$60,000-74,999<br />
$75,000+<br />
$75,000-99,999<br />
$100,000+<br />
$125,000+<br />
Multiple Income<br />
Single Income<br />
Non Working = No<br />
Non Working = Yes<br />
NHTI
Market Section Market Break Description<br />
and (2) boarders without a <strong>TV</strong> set<br />
are both considered as household<br />
members (this matches the US<br />
Census). Boarders with a <strong>TV</strong> set<br />
that do not allow <strong>Nielsen</strong> to meter<br />
the set are excluded.<br />
HH Size, HOH Age 1-2, HOH
Market Section Market Break Description<br />
than 18 may be the head of house.<br />
Persons age (become one year<br />
older) on the Monday of the week<br />
containing the 15th day of their birth<br />
month. The head of house may be<br />
male or female and may also be the<br />
lady of house.<br />
HOH Country of Origin/HOH<br />
Hispanic Specific Ethnicity<br />
Argentina, Bolivia, Chile, Colombia,<br />
Costa Rica, Cuba, Cuban - Puerto<br />
Rican, Dominican Republic,<br />
Ecuador, El Salvador, Guatemala,<br />
Honduras, Mexico, Nicaragua,<br />
Other, Other - Hispanic, Panama,<br />
Paraguay, Peru, Puerto Rico, Spain,<br />
Uruguay, Venezuela<br />
The country of origin of the Head of<br />
House.<br />
Notes<br />
• Other-Hispanic excludes<br />
Mexico and Cuban-Puerto<br />
Rican.<br />
• Effective July 2010 HOH<br />
Country of Origin was<br />
relabeled HOH Hispanic<br />
Specific Ethnicity. For<br />
measurement intervals prior<br />
to July 2010, select HOH<br />
Country of Origin. For<br />
measurement intervals after<br />
June 2010, select HOH<br />
Hispanic Specific Ethnicity.<br />
HOH Education<br />
HOH Gender<br />
HOH Occupation<br />
Market Section Market Break Description<br />
White Collar<br />
NHTI Blue Collar<br />
These occupation codes (updated<br />
periodically by the US Census<br />
Bureau) are then converted by<br />
category to <strong>Nielsen</strong> occupation<br />
categories as reported.<br />
Notes<br />
• Blue Collar = Farmer, Skilled,<br />
or Unskilled.<br />
• White Collar = Clerical or<br />
Professional/Managerial.<br />
Works Outside of Home = No<br />
Works Outside of Home = Un<br />
An indicator of whether the HOH<br />
works outside the home<br />
HOH Origin<br />
HOH Race<br />
Works Outside of Home = Yes<br />
Hispanic<br />
Non-Hispanic<br />
Black<br />
Other<br />
White<br />
Based on the ethnic origin of the<br />
household member designated as<br />
the head of the house.<br />
Based on the stated race of the<br />
household member designated as<br />
the head of the house.<br />
• Black: Any Black response,<br />
in combination with other<br />
races, is categorized as<br />
Black.<br />
• White: A person having<br />
origins in any of the original<br />
peoples of Europe, the<br />
Middle East, or North Africa.<br />
It includes people who<br />
indicate their race as White<br />
or report entries such as<br />
Irish, German, Italian,<br />
Lebanese, Near Easterner,<br />
Arab, or Polish.<br />
• Other: Some of the races<br />
include Asian, Indian, Other<br />
Asian, Japanese, Chinese,<br />
Filipino, Korean, Vietnamese,<br />
American Indian or Alaska<br />
Native, Native Hawaiian,<br />
Guamanian or Chamorro,<br />
Samoan, other Pacific<br />
Islander.<br />
Notes<br />
• Due to the sensitive nature of<br />
the racial issue, <strong>Nielsen</strong> only<br />
collects the racial origin of<br />
<strong>National</strong> <strong>TV</strong> <strong>Toolbox</strong> Data • 3-50<br />
<strong>National</strong> <strong>TV</strong> <strong>Toolbox</strong> <strong>User</strong> <strong>Guide</strong>
Market Section Market Break Description<br />
the head of the house and<br />
does not collect the racial<br />
origin of other household<br />
members.<br />
• This market break does not<br />
include Hispanic. Hispanic is<br />
not considered a race but an<br />
ethnic origin. A householder<br />
of Hispanic origin would<br />
designate his/her race using<br />
the same list. He/she may be<br />
a Black Hispanic or a White<br />
Hispanic, or other race. Each<br />
household is assigned a race<br />
and Hispanic identity.<br />
High Definition<br />
Home Ownership<br />
Home Structure Type<br />
LOH Occupation<br />
HD Capable Home = No<br />
HD Capable Home = Yes<br />
HD Capable Home = No<br />
HD Capable/Receivable Home = No<br />
HD Capable/Receivable Home =<br />
Yes<br />
HD <strong>TV</strong> Display Capable Home = No<br />
HD <strong>TV</strong> Display Capable Home =<br />
Yes<br />
2nd Home = No<br />
2nd Home = Yes<br />
Owned Rented<br />
Mobile Home<br />
Multi Family<br />
Other<br />
Single Family<br />
Blue Collar<br />
Clerical<br />
Craftsman<br />
Farmer<br />
Not in Labor Force<br />
Professional/Managerial<br />
Skilled<br />
Unknown<br />
High Definition Capable Home - A<br />
home that is equipped with an HD<br />
television and HD tuner capable of<br />
receiving signals in HD.<br />
High Definition Receivable Home - A<br />
home that is equipped with an HD<br />
television and HD tuner and<br />
receives at least one HD network or<br />
station.<br />
High Definition Display Capable<br />
Home - A home that is equipped<br />
with an HD television that is capable<br />
of displaying high definition content.<br />
Indicates whether the household<br />
owns more than one home.<br />
Indicates whether the home is<br />
owned or rented.<br />
Indicates whether the home is a<br />
mobile home, multifamily dwelling,<br />
single-family dwelling, or other.<br />
Occupation code of the lady of<br />
household that is based on <strong>Nielsen</strong>'s<br />
simplification of the Bureau of<br />
Census Occupation Classification<br />
codes.<br />
Note This market break was<br />
retired effective 08/29/11. Only<br />
historical data is available through<br />
08/28/11.<br />
<strong>National</strong> <strong>TV</strong> <strong>Toolbox</strong> <strong>User</strong> <strong>Guide</strong> <strong>National</strong> <strong>TV</strong> <strong>Toolbox</strong> Data • 3-51
Market Section Market Break Description<br />
Unskilled<br />
White Collar<br />
LOH Present<br />
Language Class<br />
Works Outside of Home = No<br />
Works Outside of Home = Un<br />
Works Outside of Home = Yes<br />
No<br />
Yes<br />
English Dominant<br />
Mostly English<br />
Mostly Spanish<br />
Non Spanish Dominant<br />
Non-Hispanic Household<br />
Only English<br />
Only Spanish<br />
Spanish Dominant<br />
Spanish English Equally<br />
An indicator of whether the Lady of<br />
House works outside the home.<br />
Note This market break was<br />
retired effective 08/29/11. Only<br />
historical data is available through<br />
08/28/11.<br />
Indicates whether there is a Lady of<br />
House.<br />
Note This market break was<br />
retired effective 08/29/11. Only<br />
historical data is available through<br />
08/28/11.<br />
The category assigned to each<br />
sample household based on the<br />
language used in the home by each<br />
adult member. The field<br />
representative collects this<br />
information during the install of the<br />
household. Language Class is used<br />
to produce any viewing information<br />
for the language categories.<br />
<strong>National</strong> <strong>TV</strong> <strong>Toolbox</strong> Data • 3-52<br />
<strong>National</strong> <strong>TV</strong> <strong>Toolbox</strong> <strong>User</strong> <strong>Guide</strong>
Market Section Market Break Description<br />
Long Distance Carrier<br />
Metered Market Indicator<br />
NHTI Language Strata<br />
AT&T<br />
MCI<br />
None<br />
Other<br />
Sprint<br />
Unknown<br />
No<br />
Yes<br />
Mostly English<br />
Mostly Spanish<br />
Non-Hispanic Household<br />
Only English<br />
Only Spanish<br />
Spanish English Equally<br />
The value for the long distance<br />
carrier.<br />
Note Long Distance Carrier data<br />
was retired effective 1/31/2011. Only<br />
historical data is available through<br />
1/30/2011 for reporting.<br />
Indicates whether the household is<br />
in a DMA (designated market area)<br />
that is a <strong>Nielsen</strong> metered market.<br />
This information is gathered during<br />
the enumeration process. Many<br />
times the person being interviewed<br />
will supply the language use for the<br />
other household members. NHTI<br />
Language Strata is used to produce<br />
the universe estimate information.<br />
This information is only valid for the<br />
Hispanic sample.<br />
<strong>Nielsen</strong> PVD Information HHLD Presence of at least 1<br />
Portable Video Game Player<br />
The household has at least one<br />
qualified portable video device<br />
(PVD).<br />
Number Of Operable PCs<br />
Number Of PCs That Are Operable<br />
= 1<br />
Number Of PCs That Are Operable<br />
= 2<br />
Number Of PCs That Are Operable<br />
= 3<br />
Number Of PCs That Are Operable<br />
= 4+<br />
Number Of Desktop PCs That Are<br />
Operable = 1<br />
Number Of Desktop PCs That Are<br />
Operable = 2<br />
Number Of Desktop PCs That Are<br />
Operable = 3<br />
Number Of Desktop PCs That Are<br />
Operable = 4+<br />
Number Of Laptop PCs That Are<br />
Operable = 1<br />
Number Of Laptop PCs That Are<br />
Operable = 2<br />
Number Of Laptop PCs That Are<br />
Operable = 3<br />
Total number of operable computers<br />
in a household by computer type or<br />
operating system.<br />
<strong>National</strong> <strong>TV</strong> <strong>Toolbox</strong> <strong>User</strong> <strong>Guide</strong> <strong>National</strong> <strong>TV</strong> <strong>Toolbox</strong> Data • 3-53
Market Section Market Break Description<br />
Number Of Laptop PCs That Are<br />
Operable = 4+<br />
Number Of Tablet PCs That Are<br />
Operable = 1<br />
Number Of Tablet PCs That Are<br />
Operable = 2<br />
Number Of Tablet PCs That Are<br />
Operable = 3<br />
Number Of Tablet PCs That Are<br />
Operable = 4+<br />
Number Of Unknown PCs That Are<br />
Operable = 1<br />
Number Of Unknown PCs That Are<br />
Operable = 2<br />
Number Of Unknown PCs That Are<br />
Operable = 3<br />
Number Of Unknown PCs That Are<br />
Operable = 4+<br />
Number Of Mac OS PCs That Are<br />
Operable = 1<br />
Number Of Mac OS PCs That Are<br />
Operable = 2<br />
Number Of Mac OS PCs That Are<br />
Operable = 3<br />
Number Of Mac OS PCs That Are<br />
Operable = 4+<br />
Number Of Windows OS PCs that<br />
Are Operable = 1<br />
Number Of Windows OS PCs that<br />
Are Operable = 2<br />
Number Of Windows OS PCs that<br />
Are Operable = 3<br />
Number Of Windows OS PCs that<br />
Are Operable = 4+<br />
Number Of iPad OS PCs That Are<br />
Operable = 1<br />
Number Of iPad OS PCs That Are<br />
Operable = 2<br />
Number Of iPad OS PCs That Are<br />
Operable = 3<br />
Number Of iPad OS PCs That Are<br />
Operable = 4+<br />
Number Of Other OS PCs that Are<br />
Operable = 1<br />
<strong>National</strong> <strong>TV</strong> <strong>Toolbox</strong> Data • 3-54<br />
<strong>National</strong> <strong>TV</strong> <strong>Toolbox</strong> <strong>User</strong> <strong>Guide</strong>
Market Section Market Break Description<br />
Number Of Other OS PCs that Are<br />
Operable = 2<br />
Number Of Other OS PCs that Are<br />
Operable = 3<br />
Number Of Other OS PCs that Are<br />
Operable = 4+<br />
Number Of Mac Make PCs That Are<br />
Operable = 1<br />
Number Of Mac Make PCs That Are<br />
Operable = 2<br />
Number Of Mac Make PCs That Are<br />
Operable = 3<br />
Number Of Mac Make PCs That Are<br />
Operable = 4+<br />
Number Of Non Mac Make PCs<br />
That Are Operable = 1<br />
Number Of Non Mac Make PCs<br />
That Are Operable = 2<br />
Number Of Non Mac Make PCs<br />
That Are Operable = 3<br />
Number Of Non Mac Make PCs<br />
That Are Operable = 4+<br />
Number Of Unknown Make PCs that<br />
Are Operable = 1<br />
Number Of Unknown Make PCs that<br />
Are Operable = 2<br />
Number Of Unknown Make PCs that<br />
Are Operable = 3<br />
Number Of Unknown Make PCs that<br />
Are Operable = 4+<br />
Number Of PCs Number Of PCs = 1<br />
Number Of PCs = 2<br />
Number Of PCs = 3<br />
Number Of PCs = 4+<br />
Total number of operable computers<br />
in a household. Includes eligible and<br />
ineligible devices that are identified<br />
as operable.<br />
Number Of Panelist Owner PCs<br />
Used For Work<br />
Number Of Panelist Owner PCs<br />
Used For Work = 1<br />
Number Of Panelist Owner PCs<br />
Used For Work = 2<br />
Number Of Panelist Owner PCs<br />
Used For Work = 3<br />
Number Of Panelist Owner PCs<br />
Used For Work = 4+<br />
Total number of operable work<br />
computers in a household. Panelist<br />
owns the PC and uses it for work.<br />
<strong>National</strong> <strong>TV</strong> <strong>Toolbox</strong> <strong>User</strong> <strong>Guide</strong> <strong>National</strong> <strong>TV</strong> <strong>Toolbox</strong> Data • 3-55
Market Section Market Break Description<br />
Number of Physical DVRs in the<br />
HHLD<br />
PC Access - Home<br />
Number of Physical DVRs in the<br />
HHLD = 1<br />
Number of Physical DVRs in the<br />
HHLD = 1+<br />
Number of Physical DVRs in the<br />
HHLD = 2<br />
Number of Physical DVRs in the<br />
HHLD = 3+<br />
No<br />
Yes<br />
PC with Internet Access - Home =<br />
No<br />
PC with Internet Access - Home =<br />
Yes<br />
Total number of physical DVR boxes<br />
in the household, regardless of DVR<br />
capability.<br />
Indicates whether the household has<br />
a personal computer.<br />
Indicates whether a household has<br />
access to the Internet.<br />
• PC with Internet Access -<br />
Home = No includes all<br />
homes without Internet<br />
access whether or not they<br />
have a PC.<br />
• PC with Internet Access -<br />
Home = Yes includes<br />
households with a PC and<br />
Internet access.<br />
Pet Ownership<br />
Presence of Children<br />
Any Dog or Cat<br />
No Dog or Cat<br />
Cat = No<br />
Cat = Yes<br />
Dog = No<br />
Dog = Yes<br />
HH W/Children 12-17 = Any<br />
HH W/Children 12-17 = None<br />
HH W/Children 2-5 = Any<br />
HH W/Children 2-5 = None<br />
Based on a household's ownership<br />
of dogs and cats.<br />
Indicates whether any cats are kept<br />
by the household.<br />
Indicates whether any dogs are kept<br />
by the household.<br />
Based on households where there<br />
are children aged 12 to 17 years<br />
living as household members. The<br />
children may or may not be related<br />
to the head of the house. Note:<br />
Household member's age on the<br />
Monday of the week that contains<br />
the 15th day of their birth month.<br />
Based on households where there<br />
are children aged 2 to 5 years living<br />
as household members. The<br />
children may or may not be related<br />
to the head of the house. Note:<br />
Household member's age on the<br />
Monday of the week that contains<br />
the 15th day of their birth month.<br />
<strong>National</strong> <strong>TV</strong> <strong>Toolbox</strong> Data • 3-56<br />
<strong>National</strong> <strong>TV</strong> <strong>Toolbox</strong> <strong>User</strong> <strong>Guide</strong>
Market Section Market Break Description<br />
Presence of Home Phone<br />
HH W/Children 6-11 = Any<br />
HH W/Children 6-11 = None<br />
HH W/Children
Market Section Market Break Description<br />
Remote Control<br />
HHLD Telephone Cable = Landline/<br />
No Cell Phone<br />
HHLD Telephone Cable = No<br />
Landline/Cell Phone<br />
HHLD Telephone Cable = No<br />
Landline/No Cell Phone<br />
No<br />
Un<br />
Yes<br />
household is a Cell Phone Only<br />
home, a Landline Only home, a<br />
home that has both cell phones and<br />
landlines and a home that has no<br />
phones.<br />
Based on whether or not the<br />
household has any <strong>TV</strong> set or VCR<br />
that can be controlled by a remote<br />
control device that can tune<br />
channels.<br />
Note This market break was<br />
retired effective 12/31/07. Only<br />
historical data is available through<br />
12/30/07.<br />
<strong>TV</strong> Ownership <strong>TV</strong> Set = 1<br />
<strong>TV</strong> Sets = 2<br />
<strong>TV</strong> Sets = 3<br />
<strong>TV</strong> Sets = 4+<br />
Based on the number of operable,<br />
metered <strong>TV</strong> sets in the household.<br />
VCRs are not included in this count.<br />
<strong>TV</strong> Sets 1-10 Based on the number of operable,<br />
metered <strong>TV</strong> sets in the household.<br />
VCRs are not included in this count.<br />
<strong>TV</strong> Sets with Pay <strong>TV</strong> Count The number of operable, metered<br />
television sets that are able to<br />
receive pay <strong>TV</strong> channels.<br />
<strong>TV</strong> Sets with Wired Cable Count Based on the number of operable,<br />
metered <strong>TV</strong> sets in the household<br />
that are wired for cable. For<br />
example, the <strong>TV</strong> set receives cable<br />
channels via a wire to the home<br />
from a cable headend located in the<br />
community. VCRs are not included<br />
in this count.<br />
<strong>TV</strong> Sets with Wired Cable and Pay Count The number of operable, metered<br />
television sets that are able to<br />
receive pay cable service from a<br />
local cable supplier. The household<br />
is wired for cable (receives cable via<br />
a wire from a community cable<br />
headend to the home) and receives<br />
pay channels for which the cable<br />
headend charges an extra premium,<br />
for example, HBO, Showtime,<br />
Cinemax, and so forth. If a home<br />
receives pay channels on any <strong>TV</strong><br />
set and if the home is also "wired" to<br />
<strong>National</strong> <strong>TV</strong> <strong>Toolbox</strong> Data • 3-58<br />
<strong>National</strong> <strong>TV</strong> <strong>Toolbox</strong> <strong>User</strong> <strong>Guide</strong>
Market Section Market Break Description<br />
receive cable channels, then the<br />
home is considered a pay "wired"<br />
cable home.<br />
Territory<br />
East Central<br />
Northeast<br />
Pacific<br />
Southeast<br />
Southwest<br />
West Central<br />
NHTI =Central<br />
Based on the physical location of a<br />
household. The <strong>Nielsen</strong> definitions<br />
of US Territories (6-way split) by the<br />
states that each territory<br />
encompasses are described in the<br />
<strong>National</strong> Reference Supplement.<br />
Time Zone<br />
Upper Demos<br />
Central<br />
Eastern<br />
Mountain<br />
Mountain East<br />
Mountain West<br />
Pacific<br />
$100K+ W/1+ College = No<br />
$100K+ W/1+ College = Yes<br />
$100K+ W/Child = No<br />
$100K+ W/Child = Yes<br />
$100K+ POM = No<br />
$100K+ POM = Yes<br />
$125K+ W/1+ College = No<br />
$125K+ W/1+ College = Yes<br />
$125K+ W/Child = No<br />
$125K+ W/Child = Yes<br />
Based on the time zone of the<br />
county in which the household is<br />
located. Time Zones are delineated<br />
in the <strong>National</strong> Reference<br />
Supplement. The mountain time<br />
zone is divided into Mountain East<br />
and Mountain West. This division is<br />
to simulate the boundary between<br />
households that receive the west<br />
coast feed versus those that receive<br />
the east coast feed of a broadcast<br />
network or cable network. As a rule,<br />
Mountain West encompasses those<br />
homes that are in the mountain time<br />
zone, but also in the Pacific territory.<br />
Indicates whether or not the<br />
household income is >100K and the<br />
HOH has >1 year of College<br />
education.<br />
Indicates whether or not the<br />
household income is >100K and at<br />
least one household member is 100K and the<br />
HOH is a Professional or Manager.<br />
Indicates whether or not the<br />
household income is >125K and the<br />
HOH has >1 year of College<br />
education.<br />
Indicates whether or not the<br />
household income is >125K and at<br />
least one household member is
Market Section Market Break Description<br />
VCR Ownership<br />
Vehicles<br />
$125K+ POM = No<br />
$125K+ POM = Yes<br />
$40K+, Multiple Income<br />
$50K+ W/1+ College = No<br />
$50K+ W/1+ College = Yes<br />
$50K+ W/Child = No<br />
$50K+ W/Child = Yes<br />
$50K+ POM = No<br />
$50K+ POM = Yes<br />
$75K+ W/1+ College = No<br />
$75K+ W/1+ College = Yes<br />
$75K+ W/Child = No<br />
$75K+ W/Child = Yes<br />
$75K+ POM = No<br />
$75K+ POM = Yes<br />
No<br />
Yes<br />
1 Car<br />
2+ Cars<br />
Any Car<br />
Domestic = No<br />
Domestic = Un<br />
Domestic = Yes<br />
Indicates whether or not the<br />
household income is >125K and the<br />
HOH is a Professional or Manager.<br />
Indicates the household income is<br />
>40K with two or more people<br />
contributing to the income.<br />
Indicates whether or not the<br />
household income is >50K and the<br />
HOH has >1 year of College<br />
education.<br />
Indicates whether or not the<br />
household income is >50K and at<br />
least one household member is 50K and the<br />
HOH is a Professional or Manager.<br />
Indicates whether or not the<br />
household income is >75K and the<br />
HOH has >1 year of College<br />
education.<br />
Indicates whether or not the<br />
household income is >75K and at<br />
least one household member is 75K and the<br />
HOH is a Professional or Manager.<br />
Based on whether the household<br />
has a video cassette recorder.<br />
The interpretation of the total count<br />
of the number of vehicles that are<br />
classified as cars. Based on a<br />
household's car ownership. Note:<br />
Vans, pick-up trucks, sports utility<br />
vehicles (Chevy Blazers, Isuzu<br />
Troopers, and so on), and utility<br />
trucks/vans are not classified as<br />
cars.<br />
Indicates that there is a vehicle<br />
operated by the household that is<br />
classified as a domestic vehicle.<br />
<strong>National</strong> <strong>TV</strong> <strong>Toolbox</strong> Data • 3-60<br />
<strong>National</strong> <strong>TV</strong> <strong>Toolbox</strong> <strong>User</strong> <strong>Guide</strong>
Market Section Market Break Description<br />
Foreign = No<br />
Foreign = Un<br />
Foreign = Yes<br />
New Car Prospect = No<br />
New Car Prospect = Un<br />
New Car Prospect = Yes<br />
New Car Prospect Last 5 Years =<br />
No<br />
New Car Prospect Last 5 Years =<br />
Un<br />
New Car Prospect Last 5 Years =<br />
Yes<br />
New Truck Prospect = No<br />
New Truck Prospect = Un<br />
New Truck Prospect = Yes<br />
1 Truck<br />
2+ Trucks<br />
Any Truck<br />
Indicates that there is a vehicle<br />
operated by the household that is<br />
classified as a foreign vehicle.<br />
Indicates if a car purchase was<br />
made by the household in the last<br />
three years. Household owns a<br />
vehicle that is classified as a car,<br />
and (1) the vehicle was bought new<br />
or leased (not bought used), and (2)<br />
the vehicle is within the last three<br />
model years of cars. The base<br />
model year is updated yearly in<br />
September. In September 2001, the<br />
base year was updated from 2000 to<br />
2001. From September 2001 until<br />
August 2002, any car with a model<br />
year of 1999-2002 would meet the<br />
"last 3 model years" criteria.<br />
Household owns a vehicle that is<br />
classified as a car, and (1) the<br />
vehicle was bought new or leased<br />
(not bought used), and (2) the<br />
vehicle is within the last five model<br />
years of cars.<br />
Household owns a vehicle that is<br />
classified as a truck, and (1) the<br />
vehicle was bought new or leased<br />
(not bought used) and (2) the<br />
vehicle is within the last five model<br />
years of trucks. Note: the base<br />
model year is updated yearly in<br />
September. In September 2001, the<br />
base year was updated from 2000 to<br />
2001. From September 2001 until<br />
August 2002, any truck with a model<br />
year of 1997-2002 would meet the<br />
"last 5 model years" criteria. Note:<br />
vehicle age is based on a 3 year<br />
criteria for cars and 5 years for<br />
trucks.<br />
The interpretation of the total count<br />
of the number of vehicles that are<br />
classified as trucks. Based on a<br />
household's truck ownership. Note:<br />
Vans, pick-up trucks, sports utility<br />
vehicles, and utility trucks/vans are<br />
classified as trucks.<br />
<strong>National</strong> <strong>TV</strong> <strong>Toolbox</strong> <strong>User</strong> <strong>Guide</strong> <strong>National</strong> <strong>TV</strong> <strong>Toolbox</strong> Data • 3-61
Market Section Market Break Description<br />
Video Game Owner<br />
No<br />
Un<br />
Yes<br />
Indicates whether the home owns at<br />
least one video game that can be<br />
connected to a viewable <strong>TV</strong> set or<br />
associated <strong>TV</strong> tuner such as a VCR.<br />
<strong>National</strong> <strong>TV</strong> <strong>Toolbox</strong> Data • 3-62<br />
<strong>National</strong> <strong>TV</strong> <strong>Toolbox</strong> <strong>User</strong> <strong>Guide</strong>
Demographic Descriptions<br />
The table below provides a description of the demographics available for reporting.<br />
Optional Person<br />
Characteristics<br />
Gender<br />
Value<br />
Persons<br />
Female<br />
Male<br />
Household<br />
Description<br />
The textual description for the sex of<br />
the person.<br />
Persons includes both Female and<br />
Male.<br />
Household represents the total<br />
households in the sample.<br />
Age Range 2 to 99+ The age of the household member<br />
on the Monday of the week<br />
containing the 15th day of their birth<br />
month.<br />
Note MarketBreaks reports use<br />
building block demographics;<br />
therefore, you can use the building<br />
blocks to create larger groups. For<br />
example, MarketBreaks has building<br />
blocks 2-5, 6-8, 9-11, and so forth.<br />
Please note that respondent level<br />
demographics are not available in<br />
MarketBreaks.<br />
College<br />
Education Ranges<br />
Hispanic Origin Language Spoken<br />
No College<br />
Some College<br />
1-3 Years College<br />
1-3 Years High School<br />
4 Years HS/Graduate<br />
4+ Years College<br />
Optional Person<br />
Characteristics<br />
Lady of Household<br />
Language Spoken<br />
Occupation<br />
Value<br />
Home Hours per Week = 10-19<br />
Home Hours per Week = 20+<br />
Work Hours per Week = 0<br />
Work Hours per Week = 01-04<br />
Work Hours per Week = 05-09<br />
Work Hours per Week = 10-19<br />
Work Hours per Week = 20+<br />
No<br />
Yes<br />
English Dominant<br />
Mostly English<br />
Mostly Spanish<br />
Non-Hispanic<br />
Household<br />
Only English<br />
Only Spanish<br />
Spanish Dominant<br />
Spanish English Equally<br />
Unknown<br />
Clerical<br />
Farmer<br />
Not in Labor Force<br />
Professional/Managerial<br />
Skilled<br />
Unskilled<br />
Description<br />
maximum number of hours available<br />
in a week is 168 hours. The question<br />
is asked of all persons 2+ in the<br />
household regardless of whether the<br />
person has access to a personal<br />
computer and/or Internet at home.<br />
Some respondents may include<br />
hours spent on the Internet using<br />
other devices such as cell phone<br />
and <strong>TV</strong>.<br />
Internet Usage-Work - In a typical<br />
week, the number of hours a person<br />
spends on the internet at work or<br />
while performing work-related<br />
activities away from home including<br />
e-mail usage. The maximum number<br />
of hours available in a week is 168<br />
hours. The question is asked of all<br />
employed persons 2+ in the<br />
household.<br />
The Lady of House is determined by<br />
the relationship to head of house<br />
and must be a female at least 18<br />
years old. The Lady of House<br />
cannot be a visitor. The same<br />
person may be both Head of House<br />
and Lady of House.<br />
This is the language spoken for<br />
each person in a household.<br />
Note Non-Hispanic Household is<br />
determined by the following:<br />
• Market Break - HOH Origin =<br />
Non Hispanic<br />
• Person Origin = Non<br />
Hispanic or Unknown<br />
The <strong>Nielsen</strong> Company collects the<br />
job title and employer of each adult<br />
household member. Using this<br />
information, <strong>Nielsen</strong> converts each<br />
adult's occupation into standardized<br />
US Census Occupation codes.<br />
These occupation codes (updated<br />
periodically by the US Census<br />
Bureau) are then converted by<br />
<strong>National</strong> <strong>TV</strong> <strong>Toolbox</strong> Data • 3-64<br />
<strong>National</strong> <strong>TV</strong> <strong>Toolbox</strong> <strong>User</strong> <strong>Guide</strong>
Optional Person<br />
Characteristics<br />
Value<br />
Description<br />
category to <strong>Nielsen</strong> occupation<br />
categories as reported.<br />
Women W/ Presence of Children Females 18+ W/ Children
About Universe Estimates<br />
A universe estimate (UE) is the statistically-derived estimate of a total population of households or persons.<br />
These estimates represent subsets of the population that may be based on demographic categories or<br />
coverage areas.<br />
Standard universe estimates are sample-based universe estimates derived using the published Total U.S.<br />
Household and Total U.S. Persons 2+ Universe Estimates. Standard universe estimates are updated monthly<br />
to remain consistent with fluctuations in the sample.<br />
The standard process is a statistical convergence that uses a limited set of sample characteristic controls.<br />
Not every characteristic can be controlled or convergence would not be achieved.<br />
The convergence process creates a universe estimate contribution for each household and household<br />
member in the installed samples. The contributions are then summed by day for any coverage area, market<br />
break, or demographic combination the user requests. The sum is the daily sample-based universe estimate.<br />
Daily values are averaged for broader intervals.<br />
The system uses computed or custom sample-based universe estimates for any market break demographic<br />
category for which standard universe estimates are not available.<br />
Standard universe estimates should only be used within the context of reporting. Projected audiences based<br />
on these standard universe estimates at any level other than Total U.S. is not recommended because of the<br />
inherent differences in the sample, and therefore the universe estimates with smaller subsamples.<br />
The system does not produce projections from a custom universe estimate by default. <strong>User</strong>s can, however,<br />
select Display Custom Projections on the Statistics page in Ratings Analysis reports and Reach & Frequency<br />
Reports. You can also change the default behavior in <strong>User</strong> Preferences. The last column on the report output<br />
displays the UE Type. All Standard universe estimates (UE Type = S) produce projection statistics. If the UE<br />
Type is C, it is a custom universe estimate.<br />
<strong>National</strong> <strong>TV</strong> <strong>Toolbox</strong> Data • 3-66<br />
<strong>National</strong> <strong>TV</strong> <strong>Toolbox</strong> <strong>User</strong> <strong>Guide</strong>
Additional Subscriptions<br />
The following additional subscriptions are available for <strong>Nielsen</strong> NPOWER. Please contact your <strong>Nielsen</strong> Client<br />
Service Representative for more information.<br />
Additional Demographic Subscriptions<br />
Additional demographic characteristics are available on a subscription basis.<br />
Principal Movie Goers Demographics<br />
• Avid Movie Goer -This indicates how often the Principal Movie Goer visits the movie theater. It is a<br />
further filtering of the Frequent Movie Goer classification. To qualify as an 'avid' movie goer, the<br />
Principal Movie Goer must visit a movie theater more than once a month. This category includes those<br />
respondents indicating their movie going frequency as twice a month or at least once a week.<br />
• Frequent Movie Goer - This indicates how often the Principal Movie Goer visits the movie theater. To<br />
qualify as a 'frequent' movie goer, the Principal Movie Goer must visit a movie theater at least once a<br />
month. This category includes those respondents indicating their movie going frequency as once a<br />
month, twice a month, or at least once a week.<br />
• Principal Movie Goer - The household member who visits the movie theater the most.<br />
Simmons BehaviorGraphics <br />
• Adult BehaviorGraphics<br />
• Kid BehaviorGraphics<br />
• Nick BehaviorGraphics<br />
• Teen BehaviorGraphics<br />
Note For a description of each characteristic, see http://www.experian.com/simmons-research/<br />
behavioral-targeting.html<br />
Primary Shopper<br />
The household member who does most of the grocery shopping.<br />
<strong>Nielsen</strong> Mobile Characteristics<br />
Additional detailed household and person characteristics about the types of mobile devices and capabilities<br />
as well as the primary user of each device type.<br />
<strong>Nielsen</strong> PVD Characteristics<br />
Additional detailed household and person characteristics about the types of personal video devices (PVD)<br />
and capabilities as well as the primary user of each device type.<br />
Additional Market Breaks Subscriptions<br />
Additional market breaks characteristics are available on a subscription basis.<br />
<strong>Nielsen</strong> Local People Meter (LPM) Markets (in NPM)<br />
DMA = Atlanta, Baltimore, Boston (Manchester), Charlotte, Chicago, Cleveland (Akron), Dallas / Ft. Worth,<br />
Detroit, Houston, Los Angles, Miami / Ft. Lauderdale, Minneapolis / St. Paul, New York, Orlando, Phoenix,<br />
Pittsburgh, Portland (OR), Sacramento, San Francisco-Oak-San Jose, Seattle / Tacoma, St. Louis, Tampa<br />
(St. Pete), Washington DC.<br />
<strong>National</strong> <strong>TV</strong> <strong>Toolbox</strong> <strong>User</strong> <strong>Guide</strong> <strong>National</strong> <strong>TV</strong> <strong>Toolbox</strong> Data • 3-67
<strong>Nielsen</strong> Claritas PRIZM<br />
The industry-leading consumer segmentation system that yields the richest, most comprehensive and precise<br />
insights available. PRIZM ® combines demographic, consumer behavior, and geographic data to help<br />
marketers identify, understand, and market to their customers and prospects. PRIZM defines 66<br />
demographically and behaviorally distinct types or "segments" to help marketers discern those consumers'<br />
likes, dislikes, lifestyles, and purchase behaviors.<br />
<strong>Nielsen</strong> Claritas ConneXions<br />
The premier segmentation system for communications and electronics marketers. ConneXions ® classifies<br />
every U.S. household into one of 53 consumer segments based on the video, voice, and data purchasing<br />
preferences of that household.<br />
<strong>Nielsen</strong> Claritas P$YCLE<br />
A household segmentation system that groups consumers into 58 segments based on income producing<br />
assets and a wide variety of financial and investment behavior. The 58 P$YCLE ® segments fit within 12<br />
Lifestage Groups based on age, family structure, income, and assets.<br />
<strong>Nielsen</strong> Mobile Characteristics<br />
Additional detailed household and person characteristics about the types of mobile devices and capabilities<br />
as well as the primary user of each device type.<br />
<strong>Nielsen</strong> PVD Characteristics<br />
Additional detailed household and person characteristics about the types of personal video devices (PVD)<br />
and capabilities as well as the primary user of each device type.<br />
<strong>National</strong> <strong>TV</strong> <strong>Toolbox</strong> Data • 3-68<br />
<strong>National</strong> <strong>TV</strong> <strong>Toolbox</strong> <strong>User</strong> <strong>Guide</strong>
Chapter 4<br />
Report Specifications Overview<br />
This chapter provides an overview of report specifications and describes some of the features available when<br />
creating a report specification.<br />
■<br />
■<br />
■<br />
■<br />
■<br />
■<br />
About the Specification Definition Page<br />
Creating a Specification<br />
Viewing or Editing a Report Specification<br />
Sharing a Specification<br />
Unsharing a Specification<br />
Deleting a Specification<br />
<strong>National</strong> <strong>TV</strong> <strong>Toolbox</strong> <strong>User</strong> <strong>Guide</strong> Report Specifications Overview • 4-69
About the Specification Definition Page<br />
The Specification Definition page is the first page displayed after selecting a report type from the <strong>National</strong> <strong>TV</strong><br />
<strong>Toolbox</strong> home page. A report specification defines the criteria that determines what data to extract from the<br />
server.<br />
Criteria selection tabs specific to the type of report selected are displayed on the page. You can create a new<br />
specification or reuse existing specifications.<br />
Specification Definition Page Example - Unification<br />
Note An asterisk on a selection tab indicates that it is required criteria.<br />
Report Specifications Overview • 4-70<br />
<strong>National</strong> <strong>TV</strong> <strong>Toolbox</strong> <strong>User</strong> <strong>Guide</strong>
Creating a Specification<br />
A specification contains the criteria that defines what data to extract from the server. The reports you<br />
generate are based on the selections you make when defining the specification.<br />
1. From the <strong>National</strong> <strong>TV</strong> <strong>Toolbox</strong> home page, select a report type from the navigation pane on the left.<br />
2. Click New.<br />
Tip You can also double-click the report type to create a new specification.<br />
3. From the Specification Definition page, type a name for the report in the Report Name box.<br />
4. If you want to share your report, click the Shared? check box.<br />
5. Click the title bar of the Sample selection tab.<br />
Notes<br />
• If you subscribe to only one sample, that is your default sample. You do not need to select a<br />
sample each time you create a specification.<br />
• The asterisk indicates a required parameter.<br />
6. From the Sample selection page, select a sample, and then click Next Page to move to the next step<br />
in sequence.<br />
Note Some pages require that you click Add to add a selection to the Current Selections list.<br />
7. When you have completed making all of your selections, click the Specification Definition bar to<br />
return to the Specification Definition page.<br />
8. Do one of the following:<br />
• Click Save to save the specification without submitting.<br />
• Click Submit to submit.<br />
Tip When you submit a report request, the specification is automatically saved.<br />
<strong>National</strong> <strong>TV</strong> <strong>Toolbox</strong> <strong>User</strong> <strong>Guide</strong> Report Specifications Overview • 4-71
Viewing or Editing a Report Specification<br />
You can view and/or edit a report specification from the <strong>National</strong> <strong>TV</strong> <strong>Toolbox</strong> home page. Editing an existing<br />
specification expedites the process of creating a report. For example, if you want to run a report that you<br />
have run before, but with a different measurement interval, open the existing report specification, change the<br />
measurement interval, and then resubmit the request.<br />
1. From the <strong>National</strong> <strong>TV</strong> <strong>Toolbox</strong> home page, click to select a report type from the navigation pane on<br />
the left.<br />
2. Double-click the Report Name in the grid to open the Specification Definition page.<br />
3. Use the selection tabs to make desired changes to criteria.<br />
4. When you have finished making your selections, do one of the following:<br />
• Click Save to save your changes<br />
• Click Submit to submit the request for processing.<br />
Note If you want to keep the original specification, be sure to rename the specification before<br />
clicking Save.<br />
Tip When you submit a report request, the specification is automatically saved.<br />
Report Specifications Overview • 4-72<br />
<strong>National</strong> <strong>TV</strong> <strong>Toolbox</strong> <strong>User</strong> <strong>Guide</strong>
Sharing a Specification<br />
The Specification Definition page provides an option that allows you to share specifications with other users<br />
in your company. Once the specification is saved, it is available to all users from the <strong>National</strong> <strong>TV</strong> <strong>Toolbox</strong><br />
home page Shared Reports folder.<br />
1. From the <strong>National</strong> <strong>TV</strong> <strong>Toolbox</strong> home page, open the specification you want to share.<br />
2. From the Specification Definition page, select the Shared? check box.<br />
3. Click Save to save the specification.<br />
Notes<br />
• After completing these steps, saving shares the report specification or execution. It is not<br />
necessary to resubmit the specification to make the change.<br />
• When you share a specification, groups are not shared.<br />
• The original of the shared specification can only be deleted by the person who created it.<br />
Tip When you submit a report request, the specification is automatically saved.<br />
<strong>National</strong> <strong>TV</strong> <strong>Toolbox</strong> <strong>User</strong> <strong>Guide</strong> Report Specifications Overview • 4-73
Unsharing a Specification<br />
After a specification is shared, you have the ability to unshare it at any time.<br />
1. From the <strong>National</strong> <strong>TV</strong> <strong>Toolbox</strong> home page, select the report type under the Shared Reports folder.<br />
2. Click the Job Specifications tab to refresh the grid to display saved specifications.<br />
3. Open the specification you want to unshare.<br />
4. From the Specification Definition page, click to clear the Shared? check box.<br />
5. Click Save to save the specification.<br />
Note After completing these steps, saving unshares the shared report specification or execution. It<br />
is not necessary to resubmit the specification to make the change.<br />
Report Specifications Overview • 4-74<br />
<strong>National</strong> <strong>TV</strong> <strong>Toolbox</strong> <strong>User</strong> <strong>Guide</strong>
Deleting a Specification<br />
To keep your files current and ensure that you don't use an outdated specification for your reports, regularly<br />
review your specifications and delete any that you no longer use.<br />
1. From the <strong>National</strong> <strong>TV</strong> <strong>Toolbox</strong> home page, select the specification you want to delete from the Job<br />
Specifications grid.<br />
2. Click Delete.<br />
3. Click OK to confirm deletion.<br />
Note Deleting a specification deletes all report execution records and recurring reports for that<br />
specification.<br />
<strong>National</strong> <strong>TV</strong> <strong>Toolbox</strong> <strong>User</strong> <strong>Guide</strong> Report Specifications Overview • 4-75
Report Specifications Overview • 4-76<br />
<strong>National</strong> <strong>TV</strong> <strong>Toolbox</strong> <strong>User</strong> <strong>Guide</strong>
Chapter 5<br />
Criteria Selection Pages<br />
Criteria selection pages are used to specify the parameters of a report and vary by report type.<br />
■<br />
■<br />
■<br />
■<br />
■<br />
■<br />
■<br />
Selection Tabs<br />
About Criteria Selection Pages<br />
Functions Available on Criteria Selection Pages<br />
Criteria Selection Toolbar<br />
About Boolean Logic<br />
Using Boolean Operators<br />
Creating a Nested Boolean Expression<br />
<strong>National</strong> <strong>TV</strong> <strong>Toolbox</strong> <strong>User</strong> <strong>Guide</strong> Criteria Selection Pages • 5-77
Selection Tabs<br />
Selection tabs are the thumbnails or rectangular areas of the Specification Definition page. Use selection tabs<br />
to define criteria for a report request.<br />
The title bar of each thumbnail defines the type of criteria. Click the title bar of a selection tab to select or edit<br />
criteria for the report specification. The white portion of the box below the title bar displays current selections,<br />
if any.<br />
Examples<br />
Note The asterisk in the title bar of a selection tab indicates required criteria. In the example above,<br />
Measurement Interval* is required criteria.<br />
The following table is an alphabetic listing of all possible selection tabs in a specification. The tabs displayed<br />
for a specification depends on the report type selected.<br />
Selection Tab<br />
Description<br />
Advertisements<br />
Builder Jobs<br />
Building Block Demographics<br />
Co-View Demographics<br />
Co-View Pairs<br />
Custom Coverage Areas<br />
Dayparts<br />
Demographics<br />
For advertisement-based schedules, select the advertisers to include in the<br />
schedule by known parent, advertiser, or Product Category Code (PCC)<br />
industry selections. Search for specific advertisement information and create<br />
groups of advertisers that you track regularly. Refine an advertiser schedule<br />
further using program characteristics.<br />
For Trend Ratings Analysis reports, select from a list of prerun builder jobs.<br />
See Demographics.<br />
See Demographics.<br />
For Co-Viewing reports, designate the primary and secondary viewers for the<br />
report.<br />
Select the custom coverage area for your report. Use Boolean logic to narrow<br />
the results to more specific information. You can also combine custom<br />
coverage areas or group them for later use. Total US is the default and is<br />
automatically included in every report.<br />
Define the dayparts you want to analyze. Select day(s) of the week and time of<br />
day. Dayparts can also be combined to create custom dayparts or grouped for<br />
later use.<br />
Select the gender and age range or Household, and then add optional person<br />
characteristics to define the scope of your target audience. Some reports<br />
provide the ability to further refine results by adding segmentation<br />
characteristics. Demographics can be grouped for later use or combined to<br />
Criteria Selection Pages • 5-78<br />
<strong>National</strong> <strong>TV</strong> <strong>Toolbox</strong> <strong>User</strong> <strong>Guide</strong>
Selection Tab<br />
Description<br />
create custom demographics. Use Boolean logic to narrow the results to very<br />
specific information.<br />
Note The label on the Demographics selection tab varies depending on the<br />
report type. For example, for segmentation reports the label is Segmentation<br />
Demographics. The label for subsets of the segmentation demographics is<br />
Profile Demographics.<br />
Feed Pattern<br />
Filter<br />
Format<br />
Frequency Distribution<br />
Internet Source<br />
Market Breaks<br />
NPOWER & MarketBreaks support the selection of several feed patterns for<br />
time period reports: primary, broadcast, dual, live, or NHTI broadcast. The<br />
default is Primary. Primary uses each cable network's individual feed. A cable<br />
network's primary feed pattern may be overridden.<br />
For Trend Ratings Analysis reports, select playback period, demographics, and<br />
market breaks on which to filter your report.<br />
Provides flexible formatting options that allow you to create a customized view<br />
of your report output.<br />
Extend your results by showing the number of times a home or person was<br />
exposed to the units within a schedule. Select from a standard frequency, or<br />
create a custom frequency distribution.<br />
For the Reach & Frequency Reports and Internet segmentation reports, specify<br />
whether to include total Internet usage or streaming only for reporting.<br />
Select market sections, and then select individual market breaks within that<br />
section to define the scope of your target audience. Use Boolean logic or<br />
nested Boolean logic to narrow the results to very specific information. Market<br />
breaks can also be combined to create custom market breaks or grouped for<br />
later use. Composite is the default and is automatically included in every<br />
report, but you do have the option to remove it if you are adding multiple<br />
Market Breaks.<br />
Note The label on the Market Breaks selection tab varies depending on the<br />
report type. For example, for segmentation reports the label is Segmentation<br />
Market Breaks. The label for subsets of the segmentation market breaks is<br />
Profile Market Breaks.<br />
Measurement Interval<br />
Playback Period and Media<br />
Sources<br />
A measurement interval can be based on a day, week, month or quarter.<br />
Measurement intervals can be combined to create custom measurement<br />
intervals or grouped for later use. Multiple measurement intervals can be<br />
included in one report if it is OTO (One Time Only).<br />
• Standard Playback Period - The standard option is used to further<br />
analyze time-shifted viewing by selecting playback period.<br />
The playback periods available are:<br />
• Live<br />
• Live+SD<br />
• Live+1 Day (+27 Hours)<br />
• Live+2 Days (+51 Hours)<br />
• Live+3 Days (+75 Hours)<br />
• Live+7 Days (+168 Hours)<br />
• Playback Only within 7 Days<br />
• Custom Playback Period - You can specify a custom playback period.<br />
<strong>National</strong> <strong>TV</strong> <strong>Toolbox</strong> <strong>User</strong> <strong>Guide</strong> Criteria Selection Pages • 5-79
Selection Tab<br />
Description<br />
Important For time-shifted viewing analyses, the playback period is<br />
tied to the viewing type selected, which should be Most Current or Live<br />
+7; therefore, crossing effective date boundaries may produce invalid<br />
data for playback periods and is strongly discouraged. Please refer to<br />
the online Help, Current Page Help for more information.<br />
• Media Source - You can also select additional media sources:<br />
• <strong>TV</strong> and Extended Screen (Default)<br />
• Extended Screen (NPOWER only)<br />
• <strong>TV</strong> (NPOWER only)<br />
Note Effective 4/25/2011 some program-based audience estimates<br />
include PC contribution for Extended Screen. For data prior to<br />
4/24/2011, data is <strong>TV</strong> only.<br />
Profile Demographics<br />
Profile Market Breaks<br />
Program Details<br />
Programs<br />
Ranking<br />
Report Segment<br />
See Demographics.<br />
See Market Breaks.<br />
For Ratings Analysis and Trend Analysis program reports, various codes,<br />
indicators, and other program characteristics are available to choose from and<br />
include as additional columns of information on your reports.<br />
Select an originator type such as broadcast, cable, or syndication, and then<br />
select from a list of originators for that originator type. Select from standard<br />
dayparts or create custom dayparts. Select program types or expanded<br />
program types and then apply advanced filters to your selections to narrow the<br />
results. If desired, search for specific programs and create groups of those<br />
programs you track on a regular basis. These options are available for program<br />
reports only.<br />
Select statistics on which to rank your report and a precision level.<br />
Select the averaging level for your reports.<br />
Note Report segments vary based on report type and service level.<br />
Respondent Demographics<br />
Sample<br />
See Demographics.<br />
NPOWER currently supports the <strong>National</strong> People Meter (<strong>National</strong>) sample, the<br />
<strong>National</strong> People Meter Hispanic (Hispanic) sample, Cross-Platform Homes<br />
(Beginning December 2009), and the <strong>National</strong> Hispanic People Meter (NHPM -<br />
Pre September 2007) sample. The Convergence Research Panel (May 2008 -<br />
November 2009) and Cross-Platform Homes (Beginning December 2009)<br />
Internet data are also available on a subscription basis. One sample may be<br />
chosen per report. Access to samples is determined based on your contract.<br />
MarketBreaks only supports the <strong>National</strong> People Meter (<strong>National</strong>) sample and<br />
the <strong>National</strong> People Meter Hispanic (Hispanic) sample.<br />
Note For Cross-Platform - Data Fusion, the existing <strong>National</strong> sample should<br />
be selected.<br />
Schedule<br />
For Reach & Frequency reports, build single or multiple schedules based on<br />
program, time period, advertisement, or Website selections. You can also<br />
specify how to build units within the schedules and select minutes within the<br />
units.<br />
Criteria Selection Pages • 5-80<br />
<strong>National</strong> <strong>TV</strong> <strong>Toolbox</strong> <strong>User</strong> <strong>Guide</strong>
Selection Tab<br />
Schedules<br />
Schedule Pairs<br />
Segmentation<br />
Segmentation Demographics<br />
Segmentation Market Breaks<br />
Statistics<br />
Description<br />
For schedule-based reports, select from a list of pre-run schedules. Schedule<br />
selections can also be combined to create custom schedules or grouped for<br />
later use.<br />
For R&F Duplication reports, designate the primary and secondary schedule<br />
(s) for the report.<br />
For segmentation reports, define how to break out segments, specify reporting<br />
levels, and select labeling preferences.<br />
See Demographics.<br />
See Market Breaks.<br />
A number of statistics are available for NPOWER reports.<br />
Note Statistics vary based on report type and service agreement.<br />
Target Feed Pattern<br />
Target Programs<br />
Target Viewing Source<br />
Unification<br />
Unified Sample<br />
Viewing Source<br />
Viewing Type<br />
See Feed Pattern.<br />
See Programs.<br />
See Viewing Source.<br />
Unification is a process that places restrictions on the homes included in a<br />
sample to create a unified sample. A sample can be unified based on the<br />
standard <strong>Nielsen</strong> day, week, month, or quarter or on a custom percentage.<br />
Select from a list of existing unified samples created from running Unification<br />
reports.<br />
Select from a list of viewing-source categories and then select specific viewing<br />
sources within the category for reporting. Viewing sources can be combined to<br />
create custom viewing sources or grouped for later use. These are available<br />
for time period reports and schedules only.<br />
Select from multiple streams of data with an additional option to select the<br />
most current data available based on the measurement interval selected.<br />
Note Prior to 12/26/05, all viewing was live.<br />
• Most Current (MC) -The latest data available, crossing viewing types, if<br />
necessary, based on the measurement interval selected. For example,<br />
selecting Most Current data for a measurement interval that is<br />
incomplete for Live+7 results in an average of the Live+7 and Live+SD<br />
data that is available to date.<br />
• Live+7 (Live plus 7 days) - Households tuning or Persons viewing a<br />
program or time period of a specific station or cable network, including<br />
VCR record, at the actual time the show was telecast, and any DVR<br />
playback tuning/viewing within 7 days (168 hours) to a pre-recorded<br />
program or time period that is shifted 'back' to original telecast time.<br />
Note When running any report based on Live+7 data, if the entire<br />
measurement interval is not loaded with the +7 data, the report will not<br />
include telecasts or daypart information for the dates where Live+7 data<br />
is not loaded.<br />
<strong>National</strong> <strong>TV</strong> <strong>Toolbox</strong> <strong>User</strong> <strong>Guide</strong> Criteria Selection Pages • 5-81
Selection Tab<br />
Websites (subscription based)<br />
Description<br />
For the R&F Internet Schedule and Internet-based segmentation reports select<br />
the Websites to include in the schedule or report by parent, brand, and channel<br />
as well as brand and channel category and sub category selections. Search for<br />
specific Website information and create groups.<br />
Criteria Selection Pages • 5-82<br />
<strong>National</strong> <strong>TV</strong> <strong>Toolbox</strong> <strong>User</strong> <strong>Guide</strong>
About Criteria Selection Pages<br />
When you click a selection tab on the specification definition page, the page that opens is called a criteria<br />
selection page. The criteria selection pages are used to define the parameters of a report.<br />
Although the report type determines which criteria are required for a report specification, the method of<br />
defining the criteria is the same regardless of report type.<br />
Criteria selection pages are divided into two panes. The top pane is used for making criteria selections to<br />
filter report data. The bottom pane displays selections added by default or selections added with the Add<br />
button in the criteria selection toolbar. You can select pages at random from the Specification Definition page<br />
or you can progress through the pages sequentially using the Next Page arrow in the toolbar.<br />
The table below describes the elements of a criteria selection page:<br />
Element<br />
Specification Definition Bar<br />
Criteria Selection Pane<br />
Groups for Bar<br />
Description<br />
Click this bar to return to the Specification Definition<br />
page to submit your report or to view current criteria<br />
selections.<br />
The top pane of a criteria selection page that displays<br />
the choices available for filtering data.<br />
Criteria selection pages with the group functionality<br />
have a Groups for bar in the middle of the<br />
page.<br />
Example (groups hidden)<br />
Click the bar to display or hide the predefined groups.<br />
Example (groups displayed)<br />
Criteria Selection Toolbar<br />
Current Selections Pane<br />
The criteria selection toolbar in the middle of the criteria<br />
selection pages displays the tools necessary to work<br />
with your criteria selections. The tools displayed vary<br />
depending on the page.<br />
The bottom pane of a criteria selection page that<br />
displays the criteria selections on which your report will<br />
be based.<br />
Tip You can use drag and drop to reorder the Current<br />
Selections on some pages. When you press the left<br />
<strong>National</strong> <strong>TV</strong> <strong>Toolbox</strong> <strong>User</strong> <strong>Guide</strong> Criteria Selection Pages • 5-83
Element<br />
Description<br />
mouse button, the pointer changes to indicate whether<br />
you can use drag and drop.<br />
Example<br />
Tips<br />
• Use Shift+click to select adjacent items in a list.<br />
• Use Ctrl+click to select non-adjacent items in a list.<br />
• Use Ctrl+click to clear a selection.<br />
• Use Reset to remove all highlighting.<br />
Criteria Selection Pages • 5-84<br />
<strong>National</strong> <strong>TV</strong> <strong>Toolbox</strong> <strong>User</strong> <strong>Guide</strong>
Functions Available on Criteria Selection Pages<br />
The functions available on a selection page are determined by report type and vary from page to page.<br />
The criteria selection toolbar displays the following tools depending on report type:<br />
The table below provides an at-a-glance, alphabetical listing of all possible selection tabs with the functions<br />
available on the page.<br />
Selection Tab<br />
Retain<br />
Combo<br />
Parts<br />
Multiple<br />
Reports<br />
Advertisements<br />
Builder Jobs<br />
Building Block<br />
Demographics<br />
Co-View Demographics<br />
Co-View Pairs<br />
Custom Coverage Areas<br />
Dayparts<br />
Feed Pattern<br />
Filter<br />
Format<br />
Frequency Distribution<br />
Internet Source<br />
Market Breaks<br />
Measurement Interval<br />
(NOT only)<br />
Playback Period and Media<br />
Source<br />
<strong>National</strong> <strong>TV</strong> <strong>Toolbox</strong> <strong>User</strong> <strong>Guide</strong> Criteria Selection Pages • 5-85
Selection Tab<br />
Retain<br />
Combo<br />
Parts<br />
Multiple<br />
Reports<br />
Profile Demographics<br />
Profile Market Breaks<br />
Program Details<br />
Programs<br />
Ranking<br />
Report Segment<br />
Respondent Demographics<br />
S&D Viewing Source<br />
Sample<br />
Schedule<br />
Schedule Pairs<br />
Schedules<br />
Segmentation<br />
Segmentation Demographics<br />
Segmentation Market Breaks<br />
Statistics<br />
Target Feed Pattern<br />
Target Programs<br />
Target Viewing Source<br />
Unification<br />
Unified Sample<br />
Viewing Source<br />
Viewing Type<br />
Websites<br />
Criteria Selection Pages • 5-86<br />
<strong>National</strong> <strong>TV</strong> <strong>Toolbox</strong> <strong>User</strong> <strong>Guide</strong>
Criteria Selection Toolbar<br />
The criteria selection tools are located in the middle of the criteria selection pages. The following table<br />
describes each tool and how it is used. Not all tools are available on every page.<br />
Tool<br />
Description<br />
Combine - Combines the currently highlighted selections in the Current Selections<br />
list. (See Retain Combo Parts.)<br />
NOT - See About Boolean Logic.<br />
AND - See About Boolean Logic.<br />
OR - See About Boolean Logic.<br />
Add Parentheses - See Nested Boolean Logic.<br />
Delete Group - Deletes the group that is currently highlighted in the Group list.<br />
New Group - Creates a group from the currently highlighted selections in the Current<br />
Selections list.<br />
Previous Page - Returns to the previous selection page.<br />
Delete - Deletes the currently highlighted selections in the Current Selections list.<br />
Reset - Clears all highlighted selections in the top pane of a criteria selection page.<br />
Next Page - Moves to the next criteria selection page.<br />
When Retain Combo Parts is checked prior to clicking Combine or selecting Cross or<br />
Cross Selected from the shortcut menu, the highlighted selections are combined to<br />
create a new selection, and the original selections are retained in the Current<br />
Selections list. If it is not checked, the new combo replaces the original selections.<br />
When Multiple Reports is checked, a separate report is generated for each selection<br />
in the Current Selections list.<br />
Note Selecting this option on one page makes it unavailable on any other page<br />
that also displays this option. For example, if you select Multiple Reports on the<br />
Market Breaks page, Multiple Reports will be unavailable on the Demographics page<br />
and the Custom Coverage Areas page.<br />
<strong>National</strong> <strong>TV</strong> <strong>Toolbox</strong> <strong>User</strong> <strong>Guide</strong> Criteria Selection Pages • 5-87
About Boolean Logic<br />
Boolean logic is a form of algebra used in computer operations to process information and solve problems.<br />
In NPOWER & MarketBreaks reports, Boolean logic is used to create what is called a Boolean expression to<br />
tell NPOWER & MarketBreaks specifically what information to include or exclude when processing a report<br />
request. Boolean expressions may be used when specifying demographics, market breaks, or custom<br />
coverage areas. Furthermore, nested Boolean logic can be used on the Market Breaks page.<br />
There are three Boolean operators used in a Boolean expression: AND, OR, and NOT. The following table<br />
describes how the operators are used to extract specific information.<br />
Important Using the Combine command, create a 'combo' of the selections you will use in an expression<br />
prior to applying operators.<br />
Operator Icon Description<br />
AND<br />
In a Boolean expression, conditions on both sides of the AND must be met in order to<br />
return results. For example, let's assume you are looking for viewers with 4 or more<br />
years of college who own a home, and you want all other viewers excluded from the<br />
report results. The Boolean expression would be:<br />
• 4+ Years College AND Home Owner<br />
When the report is submitted, the results returned will only include viewers who have 4+<br />
years of college and also own a home. Both conditions in the expression must be true<br />
for the data to be included in the report.<br />
Note When using AND, make sure what you are asking makes sense. For example,<br />
you would not create an AND relationship between County A and County B because a<br />
home could not be in County A and County B at the same time.<br />
OR<br />
In a Boolean expression, conditions on either side of the OR can be true to return<br />
results. For example, let's assume you are looking for either viewers who have 4 or more<br />
years of college or viewers who own a home. The Boolean expression would be:<br />
• 4+ Years College OR Home Owner<br />
When the report is submitted, the results returned will include viewers who have 4+<br />
years of college (do not have to own a home), viewers who are home owners (do not<br />
have to have 4+ years of college), and also viewers who have both 4+ years of college<br />
and also own a home. Only one condition needs be true for the data to be included in<br />
the report.<br />
Tips<br />
• OR is default.<br />
• Use OR to change an AND operation back to default.<br />
NOT<br />
In a Boolean expression, NOT is used to exclude specific information from a report. For<br />
example, let's assume you are looking specifically for viewers who do not own a home.<br />
The Boolean expression would be:<br />
• NOT Home Owner<br />
When the report is submitted, the results include only viewers who do not own a home.<br />
Using Boolean logic with a combo:<br />
If you are looking for viewers who have 4+ years of college who also own a home that is<br />
not located in County Size A , the Boolean expression would be:<br />
• 4+ Years of College AND<br />
• Home Owner AND<br />
• NOT County Size A<br />
Criteria Selection Pages • 5-88<br />
<strong>National</strong> <strong>TV</strong> <strong>Toolbox</strong> <strong>User</strong> <strong>Guide</strong>
Operator Icon Description<br />
When the report is submitted, the results include viewers who have 4+ years of college<br />
and also own a home in any county size except County Size A. All conditions in the<br />
expression must be true for the data to be included in the report.<br />
<strong>National</strong> <strong>TV</strong> <strong>Toolbox</strong> <strong>User</strong> <strong>Guide</strong> Criteria Selection Pages • 5-89
Using Boolean Operators<br />
Boolean operators (AND, OR, NOT) are the tools used to narrow the scope of your report request in order to<br />
extract very specific information for your report. Boolean operators are not available for all reports.<br />
The following scenario is used to describe the process of creating a Boolean expression.<br />
Scenario:<br />
You want your report results to include people with an income greater than $75K who also have 4 or more<br />
years of college and do not own a home.<br />
1. From the Specification Definition page, click the Market Breaks selection tab.<br />
2. From the Market Sections list, select HOH Education.<br />
3. From the Market Breaks list, select HOH Ed = 4+ Years College.<br />
4. Click Add to add the break to the Current Selections list.<br />
5. From the Market Sections list, select HH Income.<br />
6. From the Market Breaks list, select HH Income = $75,000+.<br />
7. Click Add to add the break to the Current Selections list.<br />
8. From the Market Sections list, select Home Ownership.<br />
9. From the Market Breaks list, select Home Ownership = Owned.<br />
10. Click Add to add the break to the Current Selections list.<br />
Note The three criteria you are looking for are listed in the Current Selection pane; however, you<br />
have not established the relationship between them yet. If you were to submit your request as it is, the<br />
results would include a row for each of the following:<br />
• All people who have 4+ years of college even if they do not earn over $75K a year or own a<br />
home.<br />
• All people who earn over $75K a year, even if they do not have 4+ years of college or own a<br />
home.<br />
• All people who own a home, regardless of income or education.<br />
11. From the Current Selections list, highlight the three criteria you are comparing and then click<br />
Combine.<br />
Note To create a relationship between selections, you must first create a combo (combine them).<br />
12. In the Please Enter Combo Name box, enter the name you want for the combo, and then click OK.<br />
Note When you generate the report, one row will be generated with the label you enter for the<br />
combo. However, you can see which selections were included in your combo on the spec tab in<br />
Microsoft Excel.<br />
13. From the Current Selections list, click the arrow to expand the folder to view your selections.<br />
Example<br />
Notes<br />
• Or is the default relationship when Combine is used.<br />
Criteria Selection Pages • 5-90<br />
<strong>National</strong> <strong>TV</strong> <strong>Toolbox</strong> <strong>User</strong> <strong>Guide</strong>
• Read the criteria from the top down. In the example above, you are looking for anyone who has<br />
4+ years of college (may or may not be a home owner), or anyone who earns over $75K (may or<br />
may not be a home owner), or anyone who is a home owner.<br />
14.<br />
Tip Use OR to change an AND operation back to default.<br />
From the Current Selections list, select all three criteria in the list, and then click AND.<br />
Example<br />
Note In the example above, you are looking for anyone who has 4+ years of college, who also<br />
earns over $75K, and who is a home owner.<br />
15. From the Current Selections list, select Home Ownership Status = Owned, and then click NOT.<br />
Example<br />
Note In the example above, you are looking for anyone who has 4+ years of college, who also<br />
earns over $75K, and who is NOT a home owner. Instead of getting three separate rows for your<br />
selections, one row with the label you entered for your combo is displayed.<br />
16. Do one of the following:<br />
• Click Next Page to move to the next step in sequence.<br />
• Click the Specification Definition bar to return to the Specification Definition page.<br />
<strong>National</strong> <strong>TV</strong> <strong>Toolbox</strong> <strong>User</strong> <strong>Guide</strong> Criteria Selection Pages • 5-91
Creating a Nested Boolean Expression<br />
Nested Boolean logic is the terminology used to describe a parenthetical Boolean expression within a<br />
Boolean expression. Nested Boolean is used to create more complex expressions to extract data for reports.<br />
For example, suppose you wanted to report Households that own three <strong>TV</strong> sets with the age of the youngest<br />
child between 6 and 11, which are both standard market breaks. The Boolean expression would be:<br />
• <strong>TV</strong> Ownership - <strong>TV</strong> Sets = 3 AND HH W/ Children, Age of Youngest 6-11<br />
If you want to report households that own 3 or more <strong>TV</strong> sets with the age of the youngest child between 6<br />
and 17, a more complex Boolean expression would be required because they are non-standard breaks. For<br />
this example, you would create a nested expression as follows:<br />
• (<strong>TV</strong> Ownership -<strong>TV</strong> Sets=3 OR <strong>TV</strong> Ownership -<strong>TV</strong> Sets = 4+) AND (HH W/ Children, Age of Youngest<br />
6-11 OR HH W/ Children, Age of Youngest 12-17)<br />
1. From the Market Breaks page, add the following market breaks to the Current Selections list:<br />
• <strong>TV</strong> Ownership - <strong>TV</strong> Sets = 3<br />
• <strong>TV</strong> Ownership - <strong>TV</strong> Sets = 4+<br />
• Presence of Children - HH W/ Children, Age of the Youngest 6-11<br />
• Presence of Children - HH W/ Children, Age of the Youngest 12-17<br />
2. From the Current Selections list, select all four breaks, and then create a combo. For our example,<br />
we will name the combo HHLDS w 3+ Sets and AOY 6-17.<br />
3. From the Current Selections list, select <strong>TV</strong> Sets = 3 and <strong>TV</strong> Sets = 4+, and then click Add<br />
Parentheses.<br />
A new ( ) folder is created with a combo of the two market breaks in an OR relationship.<br />
4. From the Current Selections list, select HH W/ Children, Age of the Youngest 6-11 and HH W/<br />
Children, Age of the Youngest 12-17, and then click Add Parentheses.<br />
Criteria Selection Pages • 5-92<br />
<strong>National</strong> <strong>TV</strong> <strong>Toolbox</strong> <strong>User</strong> <strong>Guide</strong>
A new () folder is created with a combo of the two market breaks in an OR relationship.<br />
5. From the Current Selections list, select the first () folder, and then click AND.<br />
<strong>National</strong> <strong>TV</strong> <strong>Toolbox</strong> <strong>User</strong> <strong>Guide</strong> Criteria Selection Pages • 5-93
Criteria Selection Pages • 5-94<br />
<strong>National</strong> <strong>TV</strong> <strong>Toolbox</strong> <strong>User</strong> <strong>Guide</strong>
Chapter 6<br />
Groups and Combos<br />
Groups are used to expedite the selection process. Combos are used to create custom criteria.<br />
■<br />
■<br />
■<br />
■<br />
■<br />
■<br />
■<br />
■<br />
About Groups and Combos<br />
Working with Groups<br />
Creating a Group<br />
Creating Groups from Shared Reports<br />
Creating a Combo with Combine<br />
About Cross and Cross Selected<br />
Creating a Combo with Cross<br />
Creating a Combo with Cross Selected<br />
<strong>National</strong> <strong>TV</strong> <strong>Toolbox</strong> <strong>User</strong> <strong>Guide</strong> Groups and Combos • 6-95
About Groups and Combos<br />
A group is a saved collection of criteria selections. Creating groups expedites the process of making<br />
selections. A combo is the result of manually combining standard criteria selections to create custom criteria.<br />
Groups<br />
If you frequently create reports with the same market breaks, create a group of those market breaks, and<br />
save the group. You can then use the group in other report specifications.<br />
For example, create a group of those breaks and name it Standard Breaks. When you create your next<br />
report, select the Standard Breaks group, and then click Add to add all breaks in the group to the Current<br />
Selections list.<br />
The following pages provide group functionality:<br />
• Measurement Interval<br />
• Advertisements<br />
• Programs<br />
• Schedules<br />
• Schedule Pairs<br />
• Frequency Distribution<br />
• Report Segment – LOT Time Period Report (detail level only) and LOV Program Report (detail level<br />
only)<br />
• Websites<br />
Note Classification of Parent, Brand, and Channel can change monthly; therefore, you may need to<br />
periodically redefine groups.<br />
• Dayparts<br />
• Viewing Source<br />
• Demographics<br />
• Market Breaks<br />
• Custom Coverage Areas<br />
• Playback Period and Media Source<br />
Combos<br />
You can create a combo from selections in the Current Selections list to create custom criteria.<br />
Note You must close the folders in the Current Selections list before creating a combo.<br />
The following pages provide combo functionality:<br />
• Measurement Intervals<br />
• Schedules<br />
• Dayparts<br />
• Viewing Sources<br />
• Demographics<br />
• Market Breaks<br />
• Custom Coverage Areas<br />
The name you enter when creating a combo is the name displayed on the final report. For example, if you run<br />
a report that includes individual market breaks for County A and County B, each county break is displayed in<br />
the Market Break column of the report.<br />
Groups and Combos • 6-96<br />
<strong>National</strong> <strong>TV</strong> <strong>Toolbox</strong> <strong>User</strong> <strong>Guide</strong>
If the same report request uses a combo that combines counties A and B, the Market Break column of the<br />
report displays one entry only for the counties. The entry uses the combo name.<br />
Note If you want the original selections (County Size A and County Size B) and the combined selection<br />
(Counties A and B), check Retain Combo Parts before you combine.<br />
Tip Be careful to label combos accurately. See the Spec worksheet in the Excel output to see the individual<br />
criteria in each combo.<br />
<strong>National</strong> <strong>TV</strong> <strong>Toolbox</strong> <strong>User</strong> <strong>Guide</strong> Groups and Combos • 6-97
Working with Groups<br />
Use the group feature to expedite criteria selection when building a report specification.<br />
Once you create a group, you can use the group in other reports, rename the group, or delete the group as<br />
desired. The group feature is not available on all pages.<br />
1. From a criteria selection page with the group functionality, click the Groups for bar in the<br />
middle of the page.<br />
2. Do any of the following:<br />
To ... Do the following ...<br />
Use a group<br />
Rename a group<br />
Delete a group<br />
a. Select a group from the list.<br />
b. Click Add.<br />
Note When you add a group to the Current Selections list, each<br />
item in the group is added as an individual entry just as if the<br />
selections were added one at a time.<br />
a. Right-click the group you want to rename, and then click Rename<br />
Group.<br />
b. Revise the name, and then click OK.<br />
a. Select a group from the list.<br />
b. Click Delete Group.<br />
Groups and Combos • 6-98<br />
<strong>National</strong> <strong>TV</strong> <strong>Toolbox</strong> <strong>User</strong> <strong>Guide</strong>
Creating a Group<br />
Use the group feature to expedite criteria selection when building a report specification. The group feature is<br />
not available on all pages.<br />
1. From a criteria selection page that includes the group functionality, add your criteria selections to the<br />
Current Selections list.<br />
2. Highlight the selections in the Current Selections list that you want to group.<br />
3. Click New Group.<br />
4. Enter a name for the group, and then click OK.<br />
<strong>National</strong> <strong>TV</strong> <strong>Toolbox</strong> <strong>User</strong> <strong>Guide</strong> Groups and Combos • 6-99
Creating Groups from Shared Reports<br />
Groups are specific to a user; therefore, when a user logs on, the only groups visible are the groups created<br />
by that user. When you open a shared specification, groups used to create the specification may not be<br />
visible to another user opening the specification. However, the individual components of the group are listed<br />
in the Current Selections list, and you can create your own groups from the components.<br />
1. From the <strong>National</strong> <strong>TV</strong> <strong>Toolbox</strong> home page, select a report type under the Shared Reports folder.<br />
2. Open the specification you want to work with.<br />
3. From the Specification Definition page, click the selection tab with the selections you want to group.<br />
4. From the Current Selections list, highlight the selections that you want to group.<br />
5. Click New Group.<br />
6. Enter a name for the group, and then click OK.<br />
Note It is not necessary to save the specification in order to save the group. Once you click OK, the<br />
group is saved.<br />
Groups and Combos • 6-100<br />
<strong>National</strong> <strong>TV</strong> <strong>Toolbox</strong> <strong>User</strong> <strong>Guide</strong>
Creating a Combo with Combine<br />
You can manually combine criteria in the Criteria Selections list to create custom criteria by using the<br />
Combine command in the criteria selection toolbar or from the shortcut menu.<br />
Note This feature is not available on all pages.<br />
1. From a criteria selection page that includes the combine function, add your criteria selections to the<br />
Current Selections list.<br />
2. From the Current Selections list, highlight the criteria selections you would like to combine.<br />
Note To retain the highlighted selections as individual selections in addition to creating a combo of<br />
them, click the Retain Combo Parts check box.<br />
3. Click Combine.<br />
4. In the Please Enter a Combo Name box, enter the name you want for the combo.<br />
5. Click OK.<br />
The folder labeled with the combo name you entered is displayed in the Current Selections list.<br />
Example:<br />
Note When you generate the report, one row will be generated with the label you entered for the<br />
combo. Be careful to label combinations appropriately. You will be able to see all combo contents on<br />
the Spec tab of the Excel output.<br />
6. Do one of the following:<br />
• Click Next Page to move to the next step in sequence.<br />
• Click the Specification Definition bar to return to the Specification Definition page.<br />
<strong>National</strong> <strong>TV</strong> <strong>Toolbox</strong> <strong>User</strong> <strong>Guide</strong> Groups and Combos • 6-101
About Cross and Cross Selected<br />
The Cross and Cross Selected commands are available from the shortcut menu of the Co-View<br />
Demographics/Demographics, Market Breaks, and Custom Coverage Areas pages.<br />
The Cross command is similar to the Combine command. The difference is that the Cross command<br />
automatically creates a separate combo of each item in the Current Selections list based on what you rightclick<br />
on. In addition, the combos created with the Cross command are in an AND relationship; the combos<br />
created with the Combine command are in an OR relationship.<br />
Notes<br />
• You must close the folders in the Current Selections list before creating a combo.<br />
• You cannot use Cross or Cross Selected with selections that contain ( ).<br />
• Use Cross Selected when you want to cross only the highlighted selections in the Current Selections<br />
list.<br />
For example, let us assume you have the following criteria in the Current Selections list.<br />
If you right-click HOH ED = 4+ Years College and apply the Cross command, each criteria in the Current<br />
Selections list is crossed with HOH ED = 4+ Years College. This resulting combos are in an AND<br />
relationship.<br />
Groups and Combos • 6-102<br />
<strong>National</strong> <strong>TV</strong> <strong>Toolbox</strong> <strong>User</strong> <strong>Guide</strong>
Creating a Combo with Cross<br />
You can create multiple combos from criteria in the Criteria Selections list using Cross.<br />
Note This feature is not available on all pages.<br />
1. From a criteria selection page that includes the combine function, add your criteria selections to the<br />
Current Selections list.<br />
2. From the Current Selections list, click to highlight the primary criteria selection you would like to<br />
combine with each of the other criteria selections.<br />
3. Right-click the highlighted selection.<br />
4. From the shortcut menu, select Cross. Each criterion in the Current Selections list is automatically<br />
crossed with the primary selection in an AND relationship to create a combo.<br />
Cross automatically crosses with a combo that was previously created.<br />
5. Do one of the following:<br />
• Click Next Page to move to the next step in sequence.<br />
• Click the Specification Definition bar to return to the Specification Definition page.<br />
<strong>National</strong> <strong>TV</strong> <strong>Toolbox</strong> <strong>User</strong> <strong>Guide</strong> Groups and Combos • 6-103
Creating a Combo with Cross Selected<br />
You can create multiple combos from criteria in the Criteria Selections list using Cross Selected.<br />
Note This feature is not available on all pages.<br />
1. From a criteria selection page that includes the combine function, add your criteria selections to the<br />
Current Selections list.<br />
2. Right-click the highlighted selection.<br />
3. From the shortcut menu, select Cross Selected. Each criterion in the Current Selections list is<br />
automatically crossed in an AND relationship to create a combo.<br />
4. Do one of the following:<br />
• Click Next Page to move to the next step in sequence.<br />
• Click the Specification Definition bar to return to the Specification Definition page.<br />
Groups and Combos • 6-104<br />
<strong>National</strong> <strong>TV</strong> <strong>Toolbox</strong> <strong>User</strong> <strong>Guide</strong>
Chapter 7<br />
Criteria Selection Page Descriptions<br />
This chapter provides overview information and field descriptions for the criteria selection pages.<br />
■<br />
■<br />
■<br />
■<br />
■<br />
■<br />
■<br />
■<br />
■<br />
■<br />
■<br />
■<br />
■<br />
■<br />
■<br />
■<br />
■<br />
■<br />
■<br />
■<br />
■<br />
■<br />
■<br />
■<br />
■<br />
■<br />
■<br />
■<br />
■<br />
■<br />
■<br />
Sample Page<br />
Builder Jobs Page<br />
Filter Page<br />
Viewing Type Page<br />
Playback Period and Media Source Page<br />
Measurement Interval Page<br />
Unification Page<br />
Unified Sample Page<br />
Websites Page<br />
Schedule Page<br />
Advertisements Page<br />
Programs Page<br />
Segmentation Page<br />
Schedules Page<br />
Schedule Pairs Page<br />
Statistics Page<br />
Feed Pattern Page<br />
Frequency Distribution Page<br />
Report Segment Page<br />
Program Details Page<br />
Internet Source Page<br />
Dayparts Page<br />
Viewing Source Page<br />
About Demographics<br />
Demographics Page<br />
Co-View Pairs Page<br />
About Market Breaks<br />
Market Breaks Page<br />
Custom Coverage Areas Page<br />
Ranking Page<br />
Format Page<br />
<strong>National</strong> <strong>TV</strong> <strong>Toolbox</strong> <strong>User</strong> <strong>Guide</strong> Criteria Selection Page Descriptions • 7-105
Sample Page<br />
One sample may be selected per report. Access to samples is determined based on your contract.<br />
<strong>Nielsen</strong> NPOWER currently supports the <strong>National</strong> People Meter (<strong>National</strong>) sample, the <strong>National</strong> People Meter<br />
Hispanic (Hispanic) sample, Cross-Platform Homes (beginning December 2009), and the <strong>National</strong> Hispanic<br />
People Meter (NHPM - Pre September 2007) sample. The Convergence Research Panel (May 2008 -<br />
November 2009) and Cross-Platform Homes (beginning December 2009) Internet data are also available on<br />
a subscription basis.<br />
<strong>Nielsen</strong> MarketBreaks only supports the <strong>National</strong> People Meter (<strong>National</strong>) sample and the <strong>National</strong> People<br />
Meter Hispanic (Hispanic) sample.<br />
Note Cross Platform Homes are a subsample of the <strong>National</strong> People Meter homes with dual measurement<br />
for <strong>TV</strong> and Internet Meters.<br />
Criteria Selection Page Descriptions • 7-106<br />
<strong>National</strong> <strong>TV</strong> <strong>Toolbox</strong> <strong>User</strong> <strong>Guide</strong>
Builder Jobs Page<br />
For Trend Ratings Analysis reports, the Builder Jobs page lists all of the completed Trend Analysis Builder<br />
job executions.<br />
Tips<br />
• Click the column headings to sort in ascending or descending order. The default sort order is<br />
descending by Completed Date with the most recently generated schedules at the top.<br />
• Click the magnifying glass icon to view the Specification.<br />
• Click the refresh icon to refresh the list.<br />
Page Element<br />
Include Shared<br />
Current Selections<br />
Job Name<br />
Measurement Interval<br />
Description<br />
When this is checked, shared builder jobs are displayed in the list. The default<br />
setting is unchecked, which means the shared jobs are not included in the list.<br />
The Report Name entered on the specification definition page when the builder<br />
job was submitted.<br />
Status The current status of the builder execution.<br />
Submitted The date and time the job was submitted.<br />
Dates Loaded<br />
The measurement interval selected for the job.<br />
The latest dates for which data has been loaded for the job selected, which is<br />
based on the measurement interval selected in the builder job.<br />
Shared By The user who shared the job.<br />
Job selected to define what to extract from the database for your report.<br />
<strong>National</strong> <strong>TV</strong> <strong>Toolbox</strong> <strong>User</strong> <strong>Guide</strong> Criteria Selection Page Descriptions • 7-107
Filter Page<br />
For Trend Analysis reports, the Filter page allows you to filter your report results based on selections made<br />
when running a builder job.<br />
The options available are as follows:<br />
Page Element<br />
Playback Period<br />
Demographics<br />
Market Breaks<br />
Current Selections<br />
Description<br />
Lists the playback periods available on which you can base your report.<br />
Lists the demographics available on which you can base your report.<br />
Lists the market breaks available on which you can base your report.<br />
Lists the filters that you have selected to define what to extract from the<br />
database for your report.<br />
Criteria Selection Page Descriptions • 7-108<br />
<strong>National</strong> <strong>TV</strong> <strong>Toolbox</strong> <strong>User</strong> <strong>Guide</strong>
Viewing Type Page<br />
Time-shifted viewing data is included in audience estimates effective December 26, 2005.<br />
Reporting is offered on multiple streams of data, based on report type, with an additional option to select the<br />
most current data available based on the measurement interval selected.<br />
Time-shifted data requested for measurement periods that cross pre- and post-TSV boundaries, will be<br />
reported as follows:<br />
• For the pre-TSV portion of the measurement interval, since Live is the only viewing type available prior<br />
to December 26, 2006, Live data only will be reported.<br />
• For the post-TSV portion of the measurement interval, beginning December 26, 2006 and going<br />
forward, data for the selected viewing type will be reported.<br />
Example<br />
Viewing Type: Live+7<br />
Measurement Interval: September 01, 2005 - May 31, 2006<br />
Results:<br />
September 01, 2005 - December 25, 2005 will contain Live data.<br />
December 26, 2005 - May 31, 2006 will contain Live+7 data.<br />
Viewing Type<br />
Most Current (MC)<br />
Live+7<br />
Current Selections<br />
Description<br />
The latest data available, crossing viewing types, if necessary, based on the<br />
measurement interval selected. For example, selecting Most Current data for a<br />
measurement interval that is incomplete for Live+7 results in an average of the<br />
Live+7 and Live+SD data that is available to date.<br />
Households tuning or Persons viewing a program or time period of a specific<br />
station or cable network, including VCR record, at the actual time the show<br />
was telecast, and any DVR playback tuning/viewing within 7 days (168 hours)<br />
to a pre-recorded program or time period that is shifted 'back' to original<br />
telecast time.<br />
Viewing types that you have selected to define what to extract from the<br />
database for your report.<br />
<strong>National</strong> <strong>TV</strong> <strong>Toolbox</strong> <strong>User</strong> <strong>Guide</strong> Criteria Selection Page Descriptions • 7-109
Playback Period and Media Source Page<br />
This page provides standard playback periods, the ability to create custom playback periods, and options to<br />
select media sources for reporting.<br />
Note Live is defined as 0-0 playback. Any playback is defined as 1-10,080 minutes from Live.<br />
Important When selecting playback periods, please keep in mind that the playback period will be a subset<br />
of the viewing type selected; therefore, crossing effective date boundaries may produce invalid data for<br />
playback periods and is strongly discouraged.<br />
The following are Playback Period AA effective dates:<br />
Data Reported<br />
Live<br />
Effective Dates<br />
Available for all time<br />
Live+SD Available beginning 12/26/2005<br />
Live+7 Available beginning 12/26/2005<br />
Live+X<br />
Live+X<br />
Available beginning 01/01/2007 (Program)<br />
Available beginning 08/28/2006 (Time Period)<br />
Note Program GAA Live+X is available beginning 04/02/2007.<br />
The following table provides a description of each element on the Playback Period and Media Source page:<br />
Playback Period<br />
Standard<br />
Description<br />
Pre-defined playback periods.<br />
Live<br />
Live+SD<br />
Live+1 Day (+27 hours)<br />
Live+2 Days (+51 hours)<br />
Households tuning or Persons viewing a program or time period of a specific<br />
station or cable network, including VCR record, at the actual time the show<br />
was telecast. Any use of the DVR to time shift content (regardless of how small<br />
the delay) will cause that tuning to be excluded from the Live estimates.<br />
Live is equal to 0 - 0 minutes.<br />
Households tuning or Persons viewing a program or time period of a specific<br />
station or cable network, including VCR record, at the actual time the show<br />
was telecast, and any DVR playback tuning/viewing in the same processing<br />
day to a pre-recorded program or time period that is shifted 'back' to original<br />
telecast time. The processing day is the same collection day used for daily<br />
processing; however, this will also include some households that are in<br />
different time zones than the market with which they are collected. As a result,<br />
data for some homes may be collected at 2:00 a.m. instead of 3:00 a.m. local<br />
time.<br />
Households tuning or Persons viewing a program or time period of a specific<br />
station or cable network, including VCR record, at the actual time the show<br />
was telecast, and any DVR playback tuning/viewing within 1 day (27 hours) to<br />
a pre-recorded program or time period that is shifted 'back' to original telecast<br />
time.<br />
Note This is equivalent to a Custom Playback Period of 0-1620 minutes.<br />
Households tuning or Persons viewing a program or time period of a specific<br />
station or cable network, including VCR record, at the actual time the show<br />
Criteria Selection Page Descriptions • 7-110<br />
<strong>National</strong> <strong>TV</strong> <strong>Toolbox</strong> <strong>User</strong> <strong>Guide</strong>
Playback Period<br />
Description<br />
was telecast, and any DVR playback tuning/viewing within 2 days (51 hours) to<br />
a pre-recorded program or time period that is shifted 'back' to original telecast<br />
time.<br />
Note This is equivalent to a Custom Playback Period of 0-3060 minutes.<br />
Live+3 Days (+75 hours)<br />
Households tuning or Persons viewing a program or time period of a specific<br />
station or cable network, including VCR record, at the actual time the show<br />
was telecast, and any DVR playback tuning/viewing within 3 days (75 hours) to<br />
a pre-recorded program or time period that is shifted 'back' to original telecast<br />
time.<br />
Note This is equivalent to a Custom Playback Period of 0-4500 minutes.<br />
Live+7 Days (+168 hours)<br />
Households tuning or Persons viewing a program or time period of a specific<br />
station or cable network, including VCR record, at the actual time the show<br />
was telecast, and any DVR playback tuning/viewing within 7 days (168 hours)<br />
to a pre-recorded program or time period that is shifted 'back' to original<br />
telecast time.<br />
Note This is equivalent to a Custom Playback Period of 0-10,080 minutes.<br />
Playback Only within 7 Days<br />
All DVR playback tuning/viewing within 7 days (168 hours) to a pre-recorded<br />
program or time period that is shifted 'back' to original telecast time.<br />
Important This does not include Live viewing.<br />
Note This is equivalent to a Custom Playback Period of 1-10,080 minutes.<br />
Custom<br />
Custom playback periods. Define custom playback periods by specifying<br />
minutes, hours, or days of playback to add to Live for reporting and/or define a<br />
span of minutes, hours, or days of playback only on which to report.<br />
Media Source • <strong>TV</strong> and Extended Screen (Default)<br />
• Extended Screen (NPOWER only)<br />
• <strong>TV</strong> (NPOWER only)<br />
Note 'Extended screen' is the crediting of online viewing of qualified<br />
television content to the standard television audience data, resulting in a<br />
combined national television rating beginning with data for 4/25/2011.<br />
Groups<br />
Current Selections<br />
Predefined groups of playback periods. Click to display the list.<br />
Playback periods you have selected to define what to extract from the<br />
database for your report.<br />
<strong>National</strong> <strong>TV</strong> <strong>Toolbox</strong> <strong>User</strong> <strong>Guide</strong> Criteria Selection Page Descriptions • 7-111
Measurement Interval Page<br />
The Measurement Interval page is used to select your dates for reporting. You can select multiple<br />
measurement intervals for one report. Additionally, you can create groups for frequently used measurement<br />
periods such as sweeps, holidays, sport seasons, or <strong>TV</strong> events.<br />
The following table provides a description of each element on the Measurement Interval page:<br />
Page Element<br />
Description<br />
Click the calendar icons to select dates from a pop-up calendar. Use the<br />
arrows at the top of the pop-up calendars to scroll to the desired month or year<br />
to select a date.<br />
Example<br />
Calendar Type<br />
The following calendar types are available from the Calendar Type drop-down<br />
list:<br />
• NTI - Based on the broadcast calendar.<br />
Note NTI is the default calendar. From the menu, select Options,<br />
Preferences to change the default calendar.<br />
• NHI - Based on the cable calendar.<br />
• NSS- Based on the syndication calendar.<br />
• BCST - Based on the start and end dates of the Broadcast season<br />
(typically September - May)<br />
Use the Season and Quarter drop-down lists to select from pre-defined<br />
seasons and quarters, and then click the Season or Quarter button to add that<br />
selection to the Current Selections list.<br />
The season definitions and quarter definitions vary between the calendars. For<br />
example, if you select NHI as your service, the 4th quarter includes the months<br />
of October, November, and December. However, if you select NTI as your<br />
service, the 4th quarter includes the later part of September, October,<br />
November, and December. The NTI 4th quarter typically begins in mid-<br />
September on a Monday that is determined to be the start of the season by the<br />
broadcast networks.<br />
Note With the NTI calendar selected, the first week(s) of September is<br />
included in 3Q and the last week(s) of September is included in 4Q. To include<br />
the entire month of September, choose the first date of September in 3Q and<br />
the last date of September in 4Q for the same year. Then click Add to add the<br />
measurement interval to the Current Selections list.<br />
Tip For any scheduled jobs, select the scheduling option prior to clicking the<br />
Season or Quarter button.<br />
Criteria Selection Page Descriptions • 7-112<br />
<strong>National</strong> <strong>TV</strong> <strong>Toolbox</strong> <strong>User</strong> <strong>Guide</strong>
Page Element<br />
Interactive Calendars<br />
Week Selector -<br />
Additional Options<br />
Description<br />
The calendars on the Measurement Intervals page are used to select dates.<br />
The following methods are used to select dates on the calendar:<br />
• Click to select a Start Date and then click to select an End Date.<br />
• Click the week selector to the left of a week to select the entire week.<br />
• Use Ctrl+click or click Reset in the toolbar to clear selected dates.<br />
The following additional options are available based on report type:<br />
• Avg Type - determines the type of averaging to perform.<br />
• Interval - determines the programs and or time period dayparts<br />
that will be included in the analysis based on the measurement<br />
interval the user selects. This is also the default selection.<br />
• Season Premiere to Date - provides a program average audience<br />
for a specific season, from the season premiere of the program<br />
through the latest available date within the season. This is only<br />
valid for broadcast programs.<br />
Note The season premiere may or may not correspond to the<br />
designated season start date.<br />
• Include Pre-Premieres - uses the season premiere date for all<br />
programs that premiered before the measurement period<br />
date, all others begin at the measurement period date. For<br />
those programs airing within the calendar season, that have<br />
not yet premiered for the season, the calendar season start<br />
date is used. The season end date is the next season<br />
premiere or the calendar season end date, whichever comes<br />
first.<br />
• Premiere to Date - When you select a season measurement period<br />
and premiere to date processing, the averages reported are the<br />
latest premiere through and including the end of the selected<br />
measurement interval for broadcast programs only.<br />
• Exclusions - provides the ability to exclude holidays and special days.<br />
• Inclusions (Trend Analysis Program Builder Only) - determines what<br />
data will be included in the reports:<br />
• Season to Date Logic - In order to run a Trend Analysis Program<br />
report based on season-to-date logic, users must select this option<br />
in the Trend Analysis Program Builder job and one specific<br />
season.<br />
Note Only one season can be selected when using the Season<br />
to Date Logic option.<br />
Data Availability<br />
To determine data availability, click Data Availability on the Measurement<br />
Interval page. The latest date for which data is available is color coded on the<br />
calendar.<br />
Example<br />
<strong>National</strong> <strong>TV</strong> <strong>Toolbox</strong> <strong>User</strong> <strong>Guide</strong> Criteria Selection Page Descriptions • 7-113
Page Element<br />
Description<br />
Schedule Report<br />
The measurement interval page also provides a scheduling feature that lets<br />
you create a recurring report that runs quarterly, monthly, weekly, or daily<br />
depending on report type. The default is to run the report one time only (OTO).<br />
Note You may only choose one recurring option per report. The number of<br />
reports generated depends on the recurring interval selected and the season<br />
definition, which is determined by the calendar selected.<br />
• Quarterly - A separate report is generated for each quarter of the<br />
measurement interval.<br />
• Monthly - A separate report is generated for each month of the<br />
measurement interval.<br />
• Weekly - A separate report is generated for each week of the<br />
measurement interval.<br />
• Daily - A separate report is generated for each day of the measurement<br />
interval.<br />
• OTO (One Time Only) - One report is generated for the measurement<br />
interval selected.<br />
• Time Period Viewing drop-down - This drop-down list becomes active<br />
when scheduling reports other than OTO. The selections in the list<br />
match the Data Availability options.<br />
When reports are scheduled to run quarterly, monthly, weekly, or daily, you are<br />
also given the Time Period Viewing option to select a specific type of data to<br />
include in the report. The selections in the list match the Data Availability<br />
options.<br />
The data types are:<br />
• Time Period Viewing<br />
• Time Period Viewing Live+7<br />
• Time Period Viewing + 3AM to 6AM<br />
Note Select this option for any time period report with a 6AM to 6AM<br />
daypart to ensure that the last day of the measurement interval is a<br />
complete day of data.<br />
• Cable Programs<br />
• Cable Programs Live+7<br />
• Broadcast Prime<br />
• Broadcast Weekly<br />
• Broadcast Live+7<br />
• Syndication<br />
• Syndication Live+7<br />
• Advertisement<br />
Criteria Selection Page Descriptions • 7-114<br />
<strong>National</strong> <strong>TV</strong> <strong>Toolbox</strong> <strong>User</strong> <strong>Guide</strong>
Page Element<br />
Description<br />
• Broadcast Early Fringe<br />
• NPM Internet<br />
Note On unification requests, the NTI or NHI calendar type is required for<br />
standard unification.<br />
Groups<br />
Current Selections<br />
A group is a named collection of criteria selections saved for later use and is<br />
used to expedite the process of making criteria selections. Groups are created<br />
by the user.<br />
The bottom pane of a criteria selection page that displays the current criteria<br />
selections on which your report will be based.<br />
Note Effective January 2006, all audience estimates are based on Live, Live+SD, or Live+7 data. Any<br />
computations or averages performed across the January 2006 boundary will include all Live, both Live and<br />
Live+SD, or Live and Live+7 data.<br />
<strong>National</strong> <strong>TV</strong> <strong>Toolbox</strong> <strong>User</strong> <strong>Guide</strong> Criteria Selection Page Descriptions • 7-115
Unification Page<br />
Unification is the process that is used to produce a sample of usable people meter households or persons for<br />
a specified number of days. Unification places restrictions on homes included in a sample.<br />
There are four standard types of unification stored in <strong>Nielsen</strong> NPOWER the day after the measurement date<br />
has passed. These types are based on the <strong>National</strong> <strong>Nielsen</strong> Calendar day, week, month, or quarter. Percent<br />
unifications are non-standard or custom unifications that are processed on the fly.<br />
Unification<br />
Standard<br />
Description<br />
For standard unification, the unification selected must match the measurement<br />
interval. For example, if you select Day as the standard unification, the<br />
measurement interval must be one <strong>Nielsen</strong> day. If you select more than one<br />
day, it will not run unless it is scheduled as recurring daily. This is also true for<br />
weekly, monthly, or quarterly reports.<br />
Note When you select a standard unification, there can only be one<br />
continuous, unbroken measurement interval per report.<br />
Day Homes must be intab on the <strong>Nielsen</strong> day(s) selected as the measurement<br />
interval. If you select more than one day, you must schedule it as recurring<br />
daily.<br />
Week Homes must be intab at least five out of the seven days (Monday - Sunday) in<br />
a <strong>Nielsen</strong> week, and Saturday and Sunday must be intab. If you select more<br />
than one week, you must schedule it as recurring weekly.<br />
Month The <strong>Nielsen</strong> month can be a four- or five-week month. If it is a four-week<br />
month, homes must be intab at least 21 out of the 28 days and at least three<br />
instances of each day of the week (Monday - Sunday) must be intab. If it is a<br />
five-week month, homes must be intab at least 26 out of the 35 days and at<br />
least three instances of each day of the week (Monday - Sunday) must be<br />
intab.<br />
Select a one-month measurement date that starts with a Monday and lasts for<br />
either 28 or 35 days (depending on the <strong>Nielsen</strong> month).<br />
Custom<br />
Quarter The <strong>Nielsen</strong> quarter can be a thirteen-week, fourteen-week, or fifteen-week<br />
quarter. If it is a thirteen-week quarter, the homes must be intab at least 68 of<br />
the 91 days, and at least nine instances of each day of the week (Monday -<br />
Sunday) must be intab. If it is a fourteen-week quarter, homes must be intab at<br />
least 74 of the 98 days, and at least 10 instances of each day of the week<br />
(Monday - Sunday) must be intab. If it is a fifteen-week quarter, homes must be<br />
intab at least 79 of the 105 days, and at least 11 instances of each day of the<br />
week (Monday - Sunday) must be intab.<br />
Select a quarter that starts with a Monday and lasts for 13, 14, or 15 weeks.<br />
For custom unification, you can select multiple, non-continuous measurement<br />
intervals.<br />
Percentage (%) - The percentage of the number of total dates in the<br />
measurement period.<br />
Number of days in measurement * % = minimum number of days that must be<br />
intab<br />
Note This number is always rounded to a whole number (.49 rounds down, .<br />
50 rounds up).<br />
You choose the unification, with 75% considered the norm. You can choose a<br />
unification as low as 1% or as high as 100%. A choice of 1% results in every<br />
household or person intab at least one day during the interval. If you choose<br />
1% or any other low unification, the unified count may be larger than the<br />
average day intab. That is because unification is a unique count of the<br />
households, not an average. With sample turnover happening every month,<br />
Criteria Selection Page Descriptions • 7-116<br />
<strong>National</strong> <strong>TV</strong> <strong>Toolbox</strong> <strong>User</strong> <strong>Guide</strong>
Unification<br />
Current Selections<br />
Description<br />
more households are intab at least one day in a month than average. The<br />
more fixed the unification, the more households fail to qualify for the<br />
segmentation. A choice of 100% results in only households or persons intab<br />
every day of the interval.<br />
Unification you have selected to define what to extract from the database for<br />
your report.<br />
<strong>National</strong> <strong>TV</strong> <strong>Toolbox</strong> <strong>User</strong> <strong>Guide</strong> Criteria Selection Page Descriptions • 7-117
Unified Sample Page<br />
The Unified Sample page displays a list of all existing unified samples that can be used for your report.<br />
Page Element<br />
Exclude Shared<br />
Displayed Executions<br />
Report Name<br />
Completed<br />
Recurring Interval<br />
Current Selections<br />
Description<br />
When this is checked, shared unified samples are not displayed in the list.<br />
When this is not checked, all shared unified samples are displayed in the list.<br />
The total number of unified sample executions displayed in the list.<br />
The Report Name entered on the specification definition page for the<br />
Unification report.<br />
The date and time the Unification report was completed.<br />
If the Unification report was run as a recurring report, the recurring interval<br />
selected.<br />
Unified sample you have selected to define what to extract from the database<br />
for your report.<br />
Note Click the column headings to sort in ascending or descending order.<br />
Criteria Selection Page Descriptions • 7-118<br />
<strong>National</strong> <strong>TV</strong> <strong>Toolbox</strong> <strong>User</strong> <strong>Guide</strong>
Websites Page<br />
With an additional subscription, <strong>Nielsen</strong> NPOWER provides reporting on selected Internet data. Website<br />
parent, brand, and channel are included with the subscription, as well as category and sub category for brand<br />
and channel.<br />
The Websites page contains everything you need to create schedules for your Reach and Frequency reports.<br />
You can also create and delete your own groups of Websites.<br />
Note Classification of Parent, Brand, and Channel can change monthly; therefore, groups may need to be<br />
redefined periodically. Please contact your <strong>Nielsen</strong> Client Service Representative for a monthly <strong>Nielsen</strong><br />
online data dictionary for the class structure.<br />
Tip Use the search if you want a shorter list of Websites based on your search criteria on the Websites<br />
page.<br />
The following table describes the possible selections on the Websites page.<br />
Tab Label Description<br />
Websites Parents The textual description of the Parent company or group of domains and URLs that<br />
are owned by the company, the company's subsidiaries and operating units.<br />
Brand<br />
Channel<br />
Include Adult<br />
Sites<br />
Search for<br />
Selection Within<br />
The Brand level resides one level under the Parent level. This level consists of the<br />
aggregation of a lower level called the Channel level.<br />
The Channel level is the lowest level of the hierarchy and always resides under the<br />
Brand level.<br />
When checked, includes adult sites in the results.<br />
This is used in conjunction with the Wild Card search. Use it to narrow the search<br />
by specifying the parameter to search:<br />
Wild Card<br />
Search<br />
Search<br />
• Parent - Search through the Parent.<br />
• Brand - Search through the Brand.<br />
• Channel - Search through the Channel.<br />
Use the text box to search for specific information. Type what you are looking for<br />
into the text box.<br />
Contains - Check this to search when you have partial Internet source information<br />
or are not sure of the exact Parent, Brand, or Channel. Search using any letters or<br />
combination of letters that are found in the name of the Parent, Brand, or Channel<br />
you wish to locate. For example, if you are not sure if the Parent name is XYZ<br />
Company or The XYZ Company, you can select Contains and type XYZ in the text<br />
box.<br />
Click this to search for Websites based on your selections.<br />
Brand Brand Category The textual value associated with the brand grouping of similar content.<br />
Channel<br />
Brand Sub<br />
Category<br />
Channel<br />
Category<br />
Channel Sub<br />
Category<br />
The textual value used to further refine the classification of the brand grouping.<br />
The textual value associated with the channel grouping of similar content.<br />
The textual value used to further refine the classification of the channel grouping.<br />
<strong>National</strong> <strong>TV</strong> <strong>Toolbox</strong> <strong>User</strong> <strong>Guide</strong> Criteria Selection Page Descriptions • 7-119
Schedule Page<br />
The Schedule page lets you define how you want your schedules built, how you want the minutes grouped or<br />
broken out into units, and which minutes within those units to select.<br />
The schedule page is divided into three sections:<br />
• Build Schedules<br />
• Build Units Within Schedule<br />
• Select Minutes Within Unit<br />
Note Single schedules assume the report name of the specification. Multiple schedules assume the report<br />
name followed by the schedule breakdown, for example, originator type, originator, and so forth.<br />
Page Element<br />
Description<br />
Build Schedules - determines how the schedules are created and what each schedule should include.<br />
Single Schedule<br />
Multiple Schedules<br />
R&F Advertisement Schedule Multiple Schedule Options<br />
Creates a single schedule based on all criteria selections.<br />
Creates multiple schedules based on the lowest level of criteria selected under<br />
the available options. For example, for a R&F Program Schedule, if Originator<br />
is selected under Multiple Schedules and you have five originators selected on<br />
the Programs page of the schedule, you get five schedules - one schedule for<br />
each originator for the measurement interval.<br />
Note The options available depend on the schedule type.<br />
Note For the R&F Advertisement Schedules, the units are at the individual segment level and multiple units for<br />
the same telecast are displayed. This can influence the frequency and GRP on R&F reports.<br />
Parent<br />
Advertiser<br />
Brand<br />
Brand Variant<br />
Originator Type<br />
Originator<br />
Day Of Week<br />
Standard Daypart<br />
Date<br />
Program<br />
R&F Program Schedule Multiple Schedule Options<br />
Program Selection<br />
Creates individual schedules for each parent selected on the Advertisement<br />
page.<br />
Creates individual schedules for each advertiser selected on the Advertisement<br />
page.<br />
Creates individual schedules for each brand selected on the Advertisement<br />
page.<br />
Creates individual schedules for each brand variant selected on the<br />
Advertisement page.<br />
Creates individual schedules for each originator type selected.<br />
Creates individual schedules for each originator selected.<br />
Creates individual schedules for each day of the week of the measurement<br />
interval.<br />
Creates individual schedules for each standard daypart selected.<br />
Creates individual schedules for each date of the measurement interval.<br />
Creates individual schedules for each program aired during the measurement<br />
interval that fits the criteria selected.<br />
Creates individual schedules for each Program Selection folder.<br />
Note To build multiple schedules by Originator Type, select this option and<br />
then put each Originator Type in a Program Selection folder on the Programs<br />
page.<br />
Originator<br />
Creates individual schedules for each originator selected.<br />
Criteria Selection Page Descriptions • 7-120<br />
<strong>National</strong> <strong>TV</strong> <strong>Toolbox</strong> <strong>User</strong> <strong>Guide</strong>
Page Element<br />
Day Of Week<br />
Date<br />
Standard Daypart<br />
Custom Dayparts<br />
Program<br />
Episode<br />
Every Minutes Of<br />
Program<br />
Description<br />
Creates individual schedules for each day of the week of the measurement<br />
interval.<br />
Creates individual schedules for each date of the measurement interval.<br />
Creates individual schedules for each standard daypart selected.<br />
Creates individual schedules for each custom daypart selected.<br />
Creates individual schedules for each program aired during the measurement<br />
interval that fits the criteria selected.<br />
Creates individual schedules for each episode of each program that aired<br />
during the selected measurement interval that fits the criteria you selected.<br />
Trackage Creates individual schedules for each trackage of each program that aired<br />
during the selected measurement interval that fits the criteria you selected.<br />
R&F Time Period Schedule Multiple Schedule Options<br />
Viewing Source<br />
Day Of Week<br />
Daypart<br />
Creates individual schedules for every minutes of each<br />
program that aired during the selected measurement interval that fits the<br />
criteria you selected.<br />
Creates individual schedules for each viewing source selected.<br />
Creates individual schedules for each day of the week of the measurement<br />
interval.<br />
Activates the daypart selections.<br />
Total Daypart Creates individual schedules for each daypart selected.<br />
Daily<br />
Every Minutes<br />
R&F Internet Schedule Multiple Schedule Options<br />
For example, if you select M-F 6:00 AM - 6:00 PM on the Dayparts page, one<br />
folder labeled M,T,W,R,F 6:00 AM - 6:00 PM is listed under Current Selections<br />
on the Dayparts page. Selecting Total Daypart generates one schedule<br />
labeled: M,T,W,R,F 6:00 AM - 6:00 PM.<br />
Creates individual schedules for each individual day within each daypart for the<br />
measurement interval selected.<br />
Creates individual schedules for every minutes of each<br />
individual day within each daypart for the measurement interval selected.<br />
Note These definitions are based on <strong>Nielsen</strong> Online's MarketView definitions.<br />
Parent - The Parent level is the<br />
highest level of aggregation<br />
within a single roll-up. This level<br />
consists of the aggregation of<br />
two lower levels called the Brand<br />
and Channel levels. Traffic from<br />
these lower levels will contribute<br />
the overall traffic number for the<br />
Parent level it resides under.<br />
Brand - The Brand level resides<br />
one level under the Parent level.<br />
This level consists of the<br />
aggregation of a lower level<br />
called the Channel level. Traffic<br />
from these lower levels will<br />
contribute the overall traffic<br />
number for the Brand level it<br />
resides under. This overall<br />
Creates individual schedules for each parent selected on the Websites page.<br />
Creates individual schedules for each brand selected on the Websites page.<br />
<strong>National</strong> <strong>TV</strong> <strong>Toolbox</strong> <strong>User</strong> <strong>Guide</strong> Criteria Selection Page Descriptions • 7-121
Page Element<br />
Brand level traffic, in turn, will<br />
contribute to the total traffic for<br />
its Parent. The Brand level can<br />
sometimes be represented as a<br />
subsidiary or operating unit.<br />
Channel - The Channel level is<br />
the lowest level of the<br />
MarketView hierarchal structure<br />
in which domain(s) and/or<br />
URL(s) can be aggregated<br />
under. The Channel level always<br />
resides under the Brand level.<br />
Traffic from this lower level will<br />
contribute the overall traffic<br />
number for the Brand level it<br />
resides under. This overall<br />
Brand level traffic, in turn, will<br />
contribute to the total traffic for<br />
its Parent.<br />
Description<br />
Creates individual schedules for each channel selected on the Websites page.<br />
Build Units Within Schedule - determines how you want the minutes within each schedule grouped or broken out<br />
into units. These are rows in the schedule.<br />
R&F Advertisement Schedule<br />
Telecast/Brand Variant/Spot<br />
R&F Program Schedule<br />
Every Minutes of<br />
Telecast<br />
R&F Time Period Schedule<br />
Viewing Source By Daypart<br />
Every Minutes Of<br />
Viewing Source<br />
R&F Internet Schedule<br />
Creates one unit for each advertisement spot of each telecast of the<br />
measurement interval selected.<br />
Telecast Creates one unit for each telecast of the measurement interval.<br />
Creates one unit for each minutes of each telecast of the<br />
measurement interval.<br />
For example, if the is 30, two units are created for a telecast<br />
that spans 60 minutes for the measurement interval selected.<br />
Creates one unit for each viewing source for each daypart of the measurement<br />
interval.<br />
Creates one unit for every minutes of each day of the<br />
measurement interval for each viewing source.<br />
Website By Daypart Creates one unit for each Website for each daypart of the measurement<br />
interval.<br />
Every Minutes Of<br />
Website<br />
Creates one unit for every minutes of each day of the<br />
measurement interval for each Website.<br />
Select Minutes Within Unit - determines which minutes within each unit of the schedule are selected<br />
R&F Advertisement Schedule<br />
Advertisement Minute<br />
Dominant<br />
Activates options for selecting advertisement minutes.<br />
First Selects the first minute of each advertisement within each unit.<br />
Last Selects the last minute of each advertisement within each unit.<br />
All Selects all advertisement minutes within each unit.<br />
Selects the dominant minute of each advertisement within each unit.<br />
Criteria Selection Page Descriptions • 7-122<br />
<strong>National</strong> <strong>TV</strong> <strong>Toolbox</strong> <strong>User</strong> <strong>Guide</strong>
Page Element<br />
Description<br />
Note The dominant minute is the MOP that contains the majority of national<br />
commercial seconds if a commercial spans multiple minutes. If the national<br />
commercial is evenly split, the default is the first minute.<br />
At Least <br />
Seconds of Advertisement<br />
R&F Program Schedule<br />
All Minutes<br />
First Minute<br />
Mid Minute<br />
Last Minute<br />
Select Minute <br />
Every Minutes<br />
<strong>National</strong> Commercial Minutes<br />
With At Least <br />
Seconds<br />
Include Promos<br />
Random <strong>National</strong> Commercial<br />
Minutes<br />
R&F Time Period Schedule<br />
All Minutes In Daypart<br />
First Minutes<br />
Mid Minute<br />
Last Minutes<br />
Select Minute <br />
Every Minutes<br />
R&F Internet Schedule<br />
All Minutes In Daypart<br />
Specifies the minimum number of seconds an advertisement must span in<br />
order to be selected within each unit.<br />
Selects all minutes in each program within each unit.<br />
Selects the first minute of each program within each unit.<br />
Selects the mid minute of each program within each unit.<br />
Selects the last minute of each program within each unit.<br />
Specifies which minute of each program to select within each unit.<br />
Specifies an increment of minutes of each program to select<br />
within each unit.<br />
Specifies the minimum number of seconds a national commercial must span in<br />
order to be selected within each unit.<br />
Note For R&F Program Schedules, if Commercial Minutes With At Least X<br />
Seconds and its dependents are selected in multi-segment programs<br />
(broadcast complex and syndication) AT, the units are at the individual<br />
segment level and multiple units for the same telecast are displayed. This can<br />
influence the frequency and GRP on R&F reports.<br />
Specifies whether to include promo commercial minutes when selecting<br />
national commercial minutes within a unit.<br />
Specifies which national commercial minute to select at random within each<br />
unit.<br />
Selects all minutes in each daypart within each unit.<br />
Selects the first minutes of each daypart within each unit.<br />
Selects the mid minute of each daypart within each unit.<br />
Selects the last minutes of each daypart within each unit.<br />
Specifies which minute of each daypart to select within each unit.<br />
Selects every minutes of each daypart within each unit.<br />
Selects all minutes in each daypart within each unit.<br />
<strong>National</strong> <strong>TV</strong> <strong>Toolbox</strong> <strong>User</strong> <strong>Guide</strong> Criteria Selection Page Descriptions • 7-123
Advertisements Page<br />
<strong>Nielsen</strong> NPOWER supports reporting based on selected <strong>Nielsen</strong> MONITOR-PLUS data. Advertiser, brand,<br />
and product categories are included. An advertiser brand schedule can be further refined based on program<br />
characteristics.<br />
The Advertisement page contains everything you need to create a schedule(s) of advertisements and report<br />
on it for your reach and frequency reports. This functionality is not available for time period reports.<br />
You only perform a search if you want a shorter list of advertisements based on your selections on the<br />
Advertisers and PCC tabs of the Programs page.<br />
Note When commercial or advertisement data is selected in multi-segment programs (broadcast complex<br />
and syndication) AT, schedule units are at the individual segment level with multiple units for the same<br />
telecast displayed. This can influence the frequency and GRP on R&F reports.<br />
The following table describes the possible selections on the Advertisements page.<br />
Tab Label Description<br />
Advertisers Known Parents A further refinement or description of an Advertiser name.<br />
Advertisers<br />
Include Only Promo<br />
Exclude All Promo<br />
Search for Selection<br />
Within<br />
The textual description for the advertiser.<br />
Include only promotional advertisements in the results.<br />
Exclude all promotional advertisements from the results.<br />
This is used in conjunction with the Wild Card search. Use it to<br />
narrow the search by specifying the category to search:<br />
• Parent - Search through the Known Parent only.<br />
• Advertiser - Search through the Advertisers only.<br />
• Brand - Search through the Brand only.<br />
Note Promotional names will be under Brand.<br />
• Brand Variant - Search through the Brand Variant only.<br />
Wild Card Search<br />
Use the text box to search for specific information. Type what<br />
you are looking for in the text box.<br />
Contains - Check this to search when you have partial<br />
advertisement information or are not sure of the exact parent,<br />
advertiser, brand, or brand variant.<br />
Search<br />
Click this to search for advertisements based on your selections<br />
on the Advertisers tab as well as all selections on the PCC<br />
Selections tab.<br />
PCC Selections PCC Industry The textual value for the code used to group similar products<br />
and services.<br />
PCC Major<br />
PCC Subgroup<br />
The encoded value for a further refinement of the groupings of<br />
products or services.<br />
The most specific category associated with each brand.<br />
Results<br />
Groups for<br />
Advertisements<br />
Displays the search results based on the selections made on the Advertisers tab and the<br />
PCC Selections tab.<br />
Predefined groups of advertisements. Click to display the list.<br />
Criteria Selection Page Descriptions • 7-124<br />
<strong>National</strong> <strong>TV</strong> <strong>Toolbox</strong> <strong>User</strong> <strong>Guide</strong>
Tab Label Description<br />
Current Selections<br />
Advertisements you have selected to define what to extract from the database for your<br />
schedule.<br />
<strong>National</strong> <strong>TV</strong> <strong>Toolbox</strong> <strong>User</strong> <strong>Guide</strong> Criteria Selection Page Descriptions • 7-125
Programs Page<br />
The Programs page contains everything you need to locate specific programs and report on them for your<br />
program reports. This functionality is not available for time period reports<br />
You only perform a program search if you want a shorter list of programs based on your selections on the<br />
Filters and Advanced tabs of the Programs page.<br />
The following table describes the possible selections on the Programs page.<br />
Tab Label Description<br />
Filters Originator Type Programming sources used such as broadcast, cable, or syndication. Click<br />
to select an originator type from the list.<br />
Originators<br />
Program originators based on originator type. Click to select an originator or<br />
multiple originators from the list.<br />
Standard Dayparts • Early Fringe - NTI defines this daypart as Monday through Saturday<br />
6:00 p.m. - 8:00 p.m. and Sunday 6:00 p.m. - 7:00 p.m.<br />
• Late Fringe - NTI defines this daypart as Monday - Sunday, 11:00<br />
p.m. - 6:00 a.m.<br />
• Prime Time - This is the peak television viewing period. NTI defines<br />
this daypart as 8:00 p.m. - 11:00 p.m., Monday through Saturday<br />
and 7:00 p.m. - 11:00 p.m. on Sunday.<br />
• Weekday Afternoon - NTI defines this daypart as 10:00 a.m. - 4:30<br />
p.m.<br />
• Weekday Morning - NTI defines this daypart as 6:00 a.m. - 10:00<br />
a.m.<br />
• Weekend Daytime - NTI defines this daypart as 6:00 a.m. - 6:00<br />
p.m.<br />
Program<br />
Options<br />
Custom Daypart<br />
Summary Type<br />
Code<br />
Detailed Type<br />
Code<br />
Search<br />
Non-Commercial<br />
Live Flag<br />
Breakouts<br />
Cash Barter<br />
Complex<br />
<strong>User</strong>-defined dayparts.<br />
A category title assigned to programs that are of the same type. For<br />
example, 'Award Ceremonies.' Click to select program types from the list.<br />
Defines the content of cable telecasts in a more detailed manner. Click to<br />
include expanded program types in your report.<br />
Searches for programs based on selections on the Filters, Program<br />
Options, and Advanced tabs.<br />
Programs or telecasts that do not include commercial minutes.<br />
Indicates that the program aired live.<br />
Programs with unusual coverage or programs that did not air on the usual<br />
day or daypart and are generally excluded from season-to-date averages.<br />
Telecasts of a syndication program where all of the commercial time was<br />
made available to the station to sell local commercials. The syndicator<br />
receives a cash settlement from the station in lieu of national spots.<br />
Programs that include two or more segments of varying durations and<br />
coverages. To properly credit viewing, all segments are aligned by minute<br />
of program with the segment that has the highest coverage. Primarily used<br />
for sports events.<br />
Criteria Selection Page Descriptions • 7-126<br />
<strong>National</strong> <strong>TV</strong> <strong>Toolbox</strong> <strong>User</strong> <strong>Guide</strong>
Tab Label Description<br />
GAA<br />
Gapped<br />
Long Term<br />
Multi-day<br />
Premiere<br />
Movie<br />
The sum of the percent of households or persons tuning or viewing during<br />
the average minute of each telecast of the program, including repeat<br />
telecasts during the report interval. Duplicated tuning and viewing to the<br />
same program (or its repeat telecast) by the same household during the<br />
report period is counted each time.<br />
An interruption within a program. Occurs when viewing minutes are 'lost' in<br />
the middle of a program.<br />
Programs that aired beyond a one-week time span, so that the final<br />
processed lineup had to be built by combining a series of one-week span<br />
lineups. Long term programs are frequently movie packages that air over a<br />
series of weeks. Drop (exclude) long term programs if you want to compare<br />
only programs that air in your measurement period.<br />
A program with more than one telecast per week. In the NTI and NHTI<br />
service, a separate lineup must be submitted for each day of a multi-day<br />
program which airs in prime time. These programs are generally rated<br />
individually, although they can be reported as an average.<br />
First-run program.<br />
Specific creative productions associated with a program or category movie<br />
or movie program.<br />
Note When 'Indicators' is selected from the Search Display Columns list,<br />
the Results will display an "M" in the Indicators column.<br />
Repeats<br />
Program telecasts that have aired previously on the airing network.<br />
< 5 minutes Programs that aired less than 5 minutes.<br />
Specials<br />
Sustainers<br />
Telecasts defined as a "special" by the originator. Even if a program is not<br />
designated as a special, some of the telecasts of that program may be<br />
designated as specials.<br />
Broadcast and syndication non-commercial telecasts.<br />
Notes<br />
• Available with data beginning September 20, 2010.<br />
• Sustainers will not be included in program or network averages<br />
• The default setting is Exclude All.<br />
Advanced Program Indicators • Original programs are a network production of a first run by the<br />
network.<br />
• Acquired programs were obtained from an outside source.<br />
• Various includes a mixture of both original and acquired programs.<br />
This applies to cable networks only and is supplied by the client.<br />
Note When 'Indicators' is selected from the Search Display Columns list,<br />
the Results will display the following based on whether the item is program<br />
level or episode level.<br />
• (P-O) = Program Original<br />
• (P-A) = Program Acquired<br />
• (P-V) = Program Various<br />
<strong>National</strong> <strong>TV</strong> <strong>Toolbox</strong> <strong>User</strong> <strong>Guide</strong> Criteria Selection Page Descriptions • 7-127
Tab Label Description<br />
• (E-O) = Episode Original<br />
• (E-A) = Episode Acquired<br />
• (E-V) = Episode Various<br />
Telecast Feed<br />
Pattern<br />
Search Display<br />
Columns<br />
Duration<br />
Wild Card Search<br />
Telecast feed pattern.<br />
Options available to display as additional information on the Results tab.<br />
Specific program durations.<br />
Use to search for programs when you have a partial program title or are not<br />
sure of the exact program title.<br />
Contains- Use this if you are not sure of the exact program title. The text<br />
you enter in this box can fall anywhere in the program title.<br />
Search<br />
Searches for programs based on selections on the Filters and Advanced<br />
tabs.<br />
Groups for<br />
Programs<br />
Current<br />
Selections<br />
Predefined groups of programs. Click to display the list.<br />
Programs you have selected to define what to extract from the database for your report.<br />
Note A maximum of 14 program selections are allowed on the Programs page.<br />
Criteria Selection Page Descriptions • 7-128<br />
<strong>National</strong> <strong>TV</strong> <strong>Toolbox</strong> <strong>User</strong> <strong>Guide</strong>
Segmentation Page<br />
The Segmentation page lets you define how to break out segmentations, specify reporting levels, and select<br />
labeling preferences.<br />
The segmentation page is divided into the following sections:<br />
Section Segmentation Type Options Description<br />
Build Segmentation By<br />
Determines how to break out the segmentations.<br />
All Segmentations Single Segmentation Creates a single<br />
segmentation based on<br />
criteria selections.<br />
Program Segmentations Program Selection Viewing is segmented at<br />
the Program Selection<br />
folder level.<br />
Tip Double-click the<br />
Program Selection folder<br />
to rename it to something<br />
that identifies the contents<br />
of the folder.<br />
Originator<br />
Program<br />
Include Originator Name<br />
Viewing is segmented at<br />
the originator level.<br />
Viewing is segmented at<br />
the program level by<br />
originator.<br />
Include/exclude the<br />
program originator name in<br />
the segmentation name on<br />
the output.<br />
For example, if the report<br />
is broken out by Program,<br />
the label in the report<br />
output might look like this:<br />
• Persons 2 - 99<br />
(Originator Name |<br />
Program Name)<br />
Note If you do not have<br />
this checked and you have<br />
a program that spans<br />
multiple originators, those<br />
originators will be<br />
combined. For example, if<br />
this is not checked and<br />
Program A is on broadcast<br />
Network A and is also on<br />
cable Network B, the two<br />
networks will be combined<br />
for that program in the<br />
output.<br />
<strong>National</strong> <strong>TV</strong> <strong>Toolbox</strong> <strong>User</strong> <strong>Guide</strong> Criteria Selection Page Descriptions • 7-129
Section Segmentation Type Options Description<br />
Time Period<br />
Segmentations<br />
Viewing Source<br />
Viewing is segmented at<br />
the viewing source level.<br />
Frequency - Percent of<br />
Days<br />
NTile Breaks<br />
Quad Program and Time<br />
Period Segmentations<br />
NTile Program, Time<br />
Period, and Internet<br />
Segmentations<br />
% of Days Qualifies the viewing by<br />
defining a minimum<br />
percentage of viewing<br />
days necessary, based on<br />
the selected measurement<br />
interval, in order for the<br />
viewing to be included in<br />
the segmentation.<br />
Specifies the number of NTiles (1 - 20) in each<br />
segmentation.<br />
Tip <strong>User</strong>s can relabel NTile breaks.<br />
Duration - Number of<br />
Minutes<br />
Qualifies the viewing by defining the minimum number of minutes of viewing<br />
necessary, based on the selected measurement interval, in order for the viewing to<br />
be included in the segmentation.<br />
• Quad Program and<br />
Time Period<br />
Segmentations<br />
• Number of Minutes<br />
Program and Time<br />
Period<br />
Segmentations<br />
Minute(s)<br />
Specifies the number of<br />
minutes of viewing<br />
required across the<br />
measurement interval.<br />
Duration - Page Views<br />
Qualifies the Internet usage by defining the minimum number of seconds of Internet<br />
usage or the number of page views necessary, based on the selected measurement<br />
interval, in order for the usage to be included in the segmentation.<br />
Number of Seconds/PVs<br />
Internet Segmentations<br />
Seconds<br />
Specifies the number of<br />
seconds of Internet usage<br />
required across the<br />
measurement interval.<br />
Page Views<br />
Specifies the number of<br />
page views required<br />
across the measurement<br />
interval.<br />
Reporting Levels<br />
• All NTile<br />
Segmentations<br />
• Number of Minutes<br />
Program and Time<br />
Period<br />
Segmentations<br />
Total Minutes<br />
Total number of viewing<br />
minutes for the segment<br />
across the measurement<br />
interval.<br />
• Quad Program and<br />
Time Period<br />
Segmentations<br />
• All NTile<br />
Segmentations<br />
• Number of Minutes<br />
Program and Time<br />
Average Minutes<br />
Total minutes viewed<br />
divided by the number of<br />
days the household was<br />
intab for the segment<br />
across the measurement<br />
interval.<br />
Criteria Selection Page Descriptions • 7-130<br />
<strong>National</strong> <strong>TV</strong> <strong>Toolbox</strong> <strong>User</strong> <strong>Guide</strong>
Section Segmentation Type Options Description<br />
Period<br />
Segmentations<br />
Number of Minutes<br />
Program and Time period<br />
Segmentations<br />
Percent of Minutes<br />
Total minutes viewed<br />
divided by the total number<br />
of viewing minutes for the<br />
segment across the<br />
measurement interval.<br />
Number of Seconds/PVs<br />
Internet Segmentations<br />
Total Seconds<br />
Total number of seconds<br />
of Internet usage for the<br />
segment across the<br />
measurement interval.<br />
Average Seconds<br />
Total seconds of Internet<br />
Usage divided by the<br />
number of days the person<br />
was intab for the segment<br />
across the measurement<br />
interval.<br />
Segmentation Label<br />
(Optional)<br />
All Segmentations<br />
Include Market Breaks in<br />
Label<br />
Adds the selected<br />
Segmentation Market<br />
Break label to the<br />
Segmentation Name<br />
column in the report<br />
output. For example, if the<br />
report is broken out by<br />
Originator, the label in the<br />
report output might look<br />
like this:<br />
• Originator Name |<br />
Persons 2 - 99 |<br />
Composite<br />
<strong>National</strong> <strong>TV</strong> <strong>Toolbox</strong> <strong>User</strong> <strong>Guide</strong> Criteria Selection Page Descriptions • 7-131
Schedules Page<br />
Reach & Frequency Reports provide a Schedules page that lists all of the completed schedule executions,<br />
including completed schedule executions that were shared.<br />
Note Click the column headings to sort in ascending or descending order. The default sort order is<br />
descending by Completed Date with the most recently generated schedules at the top.<br />
The following table provides a description of each element on the Schedules page:<br />
Page Element<br />
Exclude Shared<br />
Displayed Executions<br />
Report Name<br />
Completed<br />
Recurring Interval<br />
Sample<br />
Type<br />
Description<br />
When this is checked, shared schedules are not displayed in the list. The<br />
default setting is checked. When this is not checked, all shared schedules are<br />
displayed in the list.<br />
The total number of schedule executions displayed in the list.<br />
The Report Name entered on the specification definition page for the schedule<br />
execution.<br />
The date and time the schedule execution was completed.<br />
If the schedule was set up as a recurring schedule, the recurring interval<br />
selected.<br />
The Sample selected for the schedule.<br />
The type of schedule: Advertisement, Program, or Time Period.<br />
# Schedules The total number of schedules in each execution.<br />
Schedules (Selected Units,<br />
Selected Minutes)<br />
Groups for Schedules<br />
Current Selections<br />
Each schedule within the schedule execution. The number of units selected<br />
within the schedule and the total number of minutes selected in all included<br />
units is displayed in parentheses.<br />
Predefined groups of schedules. Click to display the list.<br />
Schedules you have selected to define what to extract from the database for<br />
your report.<br />
Criteria Selection Page Descriptions • 7-132<br />
<strong>National</strong> <strong>TV</strong> <strong>Toolbox</strong> <strong>User</strong> <strong>Guide</strong>
Schedule Pairs Page<br />
For R&F Duplication reports, the Schedule Pairs page provides a list of schedules to compare.<br />
The selections available are based on the schedules selected from the Schedules tab.<br />
Page Element<br />
Primary<br />
Selected<br />
Select All<br />
Secondary<br />
Selected<br />
Select All<br />
Groups for Schedule Pairs<br />
Current Selections<br />
Description<br />
Lists schedules that can be selected as primary schedules in a schedule pair.<br />
Displays the number of schedules currently selected in the primary schedule<br />
list.<br />
Selects all schedules in the primary schedule list or clears all schedule<br />
selections in the primary schedule list.<br />
Lists schedules that can be selected as secondary schedules in a schedule<br />
pair.<br />
Displays the number of schedules currently selected in the secondary schedule<br />
list.<br />
Selects all schedules in the secondary schedule list or clears all schedule<br />
selections in the secondary schedule list.<br />
Predefined groups of schedule pairs. Click to display the list.<br />
Schedule Pairs you have selected to define what to extract from the database<br />
for your report.<br />
<strong>National</strong> <strong>TV</strong> <strong>Toolbox</strong> <strong>User</strong> <strong>Guide</strong> Criteria Selection Page Descriptions • 7-133
Statistics Page<br />
Statistics available for reporting are based on the report type.<br />
Note Selections on the Statistics page are not required on R&F reports. If there are no statistics selected,<br />
your report shows only the counts for intabs, UEs, and so forth.<br />
This following table provides an alphabetical listing of all statistics available for reporting:<br />
Statistic<br />
AA Reach<br />
Allow Non Ordered GAA<br />
Telecasts<br />
Apply Distinct Processing<br />
Description<br />
Viewing that is unduplicated for each telecast, daypart, or national commercial.<br />
A household or person viewing will only count once, regardless of the number<br />
of units they viewed that passed the qualifier.<br />
When US GAA% is selected, allows reporting of GAAs for any cable,<br />
broadcast, or syndication program, regardless of GAA Ordered status.<br />
For Reach & Frequency Reports, when selected, this option processes<br />
Average Frequency and Average Minutes without duplicate viewing. For users<br />
who do programming research, this option also provides the ability to analyze<br />
how many different episodes of a series a viewer watched.<br />
Tip <strong>User</strong> Preferences provides the option to set this as the default reach and<br />
frequency methodology if desired.<br />
Notes<br />
• Advertisement schedules should always be evaluated without the Apply<br />
Distinct Processing option selected in order to count any repeat viewing<br />
of commercial minutes.<br />
• Frequency-based statistics include: Qualified GRP % / (000) and<br />
Frequency Distribution if selected.<br />
• Average minute-based statistics include: Spot GRP % / (000.)<br />
Apply Minimums<br />
Apply Relative Error<br />
Average Minutes<br />
Average Minutes Viewed<br />
Choose Every <br />
MOP to Display<br />
Choose Every <br />
Target Minute to Display<br />
Commercial/ Promo Duration<br />
CVG AA%<br />
Adds minimum columns to all reported statistics.<br />
Adds relative error columns to all reported statistics.<br />
For duplication reports, provides the ability to include the average minute<br />
statistic for the various metrics.<br />
For ratings analyses, (AA% x Duration)/100 in Minutes = Average Minutes<br />
Viewed.<br />
For Source & Destination Program reports, indicates the MOP display interval<br />
after the start target MOP, for example, every 5th or 30th MOP.<br />
For Source & Destination Time Period reports, indicates the minute display<br />
interval after the start target minute, for example, every 5th or 30th minute.<br />
For Source & Destination Program reports, reports the actual commercial and<br />
promotional duration for each target MOP of program. This selection excludes<br />
public service announcements and local and institutional commercials, and<br />
includes direct response advertisements for commercial duration, which<br />
matches the definition of national commercial time employed in the Average<br />
Commercial Minute MIT.<br />
Coverage Area Average Audience Percent - The percentage of <strong>TV</strong> households<br />
or persons viewing the average minute of a selected program or time period<br />
within a certain coverage area.<br />
Criteria Selection Page Descriptions • 7-134<br />
<strong>National</strong> <strong>TV</strong> <strong>Toolbox</strong> <strong>User</strong> <strong>Guide</strong>
Statistic<br />
Description<br />
Note Effective 1/31/11, includes duplicate viewing for DVR playback.<br />
Effective 4/25/2011, includes any eligible PC contribution for extended screen.<br />
CVG GAA%<br />
CVG HUT/PUT and Share %<br />
CVG Index %<br />
CVG Index % P2+<br />
CVG Index % P18+<br />
Display Custom Projections<br />
Distribution<br />
Distribution (000) P2+<br />
Distribution (000) P18+<br />
Exclude Sample Information<br />
The percentage of <strong>TV</strong> households or persons viewing the average minute of a<br />
selected program and/or its repeat airings, adjusted for the program coverage.<br />
CVG HUT/PUT - Coverage Area Households Using Television/Persons Using<br />
Television percent. The percentage of households or persons using television<br />
within a cable network's coverage area and feed pattern.<br />
Share - Percentage of households or persons using television (HUT/PUT)<br />
viewing a particular program or time period within a specific coverage area.<br />
Note Effective 1/31/2011, the HUT definition was changed to households<br />
using television and DVR playback at time of playback.<br />
Coverage area households or persons average audience rating within a market<br />
break tuned to the reported cable network expressed as a percent of the total<br />
coverage area households or persons average audience rating tuned to the<br />
reported network for the daypart, time period or program.<br />
Coverage area persons average audience rating within a market break tuned<br />
to the reported cable network expressed as a percent of the total coverage<br />
persons age 2+ average audience rating for the reported cable network for the<br />
daypart, time period or program.<br />
Available for cable program and time period data only. Coverage area persons<br />
average audience rating within a market break tuned to the reported cable<br />
network expressed as a percent of the coverage persons age 18+ average<br />
audience rating for the reported cable network for the daypart, time period or<br />
program.<br />
Provides the option to display projections based off custom UEs on output.<br />
Tip You can set the default for this option from the menu by selecting<br />
Options, Preferences.<br />
Note Use this option when you want to override the default for individual<br />
reports.<br />
Audience distribution represents the ratio of a selected demographic or market<br />
break average audience projection to the total US or higher composite<br />
demographic audience projection.<br />
Total U.S. persons average audience projection for a program/originator/<br />
daypart expressed as a percent of the Total U.S. Persons 2+ average<br />
audience for the program/originator/daypart.<br />
Total U.S. persons average audience projection for a program/originator/<br />
daypart expressed as a percent of the Total U.S. Persons 18+ average<br />
audience for the program/originator/daypart.<br />
Prevents sample information from being displayed in your output.<br />
Tip You can set the default for this option from the menu by selecting<br />
Options, Preferences.<br />
Note Use this option when you want to override the default for individual<br />
reports.<br />
<strong>National</strong> <strong>TV</strong> <strong>Toolbox</strong> <strong>User</strong> <strong>Guide</strong> Criteria Selection Page Descriptions • 7-135
Statistic<br />
Exclude Long Term Visitors<br />
Exclude Short Term Visitors<br />
Extended Home Contribution AA<br />
%<br />
Description<br />
Excludes long term visitors which contribute to age, gender, and Working<br />
Women categories, but do not contribute to Lady of House.<br />
Excludes short-term visitors which contribute to age and gender only.<br />
A portion of the AA that occurred in the extended home, reported as an AA<br />
rating.<br />
For example, if the current Total US AA% is 1.5% and the Extended Home<br />
Contribution AA% is 0.3%, then the rating before the extended home viewing is<br />
1.2%.<br />
Extended Home Contribution<br />
GAA%<br />
A portion of the GAA that occurred in the extended home, reported as an GAA<br />
rating.<br />
For example, if the current Total US GAA% is 1.86% and the Extended Home<br />
Contribution GAA% is 0.07%, then the rating before the extended home<br />
viewing is 1.79%.<br />
GAA Reach<br />
Index<br />
Index % P2+<br />
Index % P18+<br />
Median Age/Median Income<br />
Viewing that includes unduplicated viewing to each minute of the program plus<br />
all duplicated viewing. Duplicated viewing is viewing to the same minutes of a<br />
program episode that had previously been viewed in another airing of the<br />
program episode. A household or person will only count once in the<br />
denominator; however, all of their viewing that passed the qualifier will be<br />
counted.<br />
Total U.S. households or persons rating within a market break for a program/<br />
originator/daypart expressed as a percent of the Total U.S. households or<br />
persons rating for the program/originator/daypart.<br />
Total U.S. persons rating within a market break for a program/originator/<br />
daypart expressed as a percent of the Total U.S. Persons 2+ rating for the<br />
program/originator/daypart.<br />
Total U.S. persons rating within a market break for a program/originator/<br />
daypart expressed as a percent of the Total U.S. Persons 18+ rating for the<br />
program/originator/daypart.<br />
The median of an age group, persons-based household income, and income<br />
midpoint range.<br />
Notes<br />
• Not available for GAA.<br />
• Effective 4/2/2007, reporting of ALL household incomes values,<br />
including historical, will use the midpoint value of household income<br />
range. For more information, see Income Ranges and Mid-points.<br />
<strong>National</strong> Commercial %<br />
<strong>National</strong> Commercial Statistics<br />
Reports the <strong>National</strong> Commercial Statistics based on the commercial<br />
parameters made in the Trend Analysis Program Builder jobs.<br />
A statistic available for program reports that will produce <strong>National</strong> Commercial<br />
ratings.<br />
Note The default <strong>National</strong> Commercial parameters are set to the ACM MIT<br />
parameters.<br />
• Include Only Programs with Commercial Activity -Designates that only<br />
programs with commercial activity are included when determining if a<br />
program qualifies in the national commercial statistics calculation.<br />
Criteria Selection Page Descriptions • 7-136<br />
<strong>National</strong> <strong>TV</strong> <strong>Toolbox</strong> <strong>User</strong> <strong>Guide</strong>
Statistic<br />
Description<br />
• Include Direct Response Advertisements - Designates that the direct<br />
response advertisement seconds are included when determining if a<br />
minute qualifies as a national commercial minute.<br />
• Exclude Public Service Announcements - Designates that the public<br />
service announcement seconds are excluded when determining if a<br />
minute qualifies as a national commercial minute.<br />
• Exclude <strong>National</strong> Promo Time - Designates that the promo seconds are<br />
excluded when determining if a minute qualifies as a national<br />
commercial minute.<br />
• Qualifier - The number of seconds of national commercial or promo<br />
time that qualifies a minute of programming as a national commercial<br />
minute.<br />
NCCM Calculation<br />
The method of calculating the <strong>National</strong> Commercial Clock Minute average.<br />
• Include Full Minutes - The average of all minutes that pass the number<br />
of seconds qualification. Regardless of the number of commercial<br />
seconds in a minute, the commercial duration is equal to 60 seconds for<br />
the commercial rating calculation.<br />
For example, if there are 45 seconds of commercial activity within a<br />
minute, it will be counted in the NCCM Duration (sec.) calculation as 60<br />
seconds.<br />
• Duration Weight - A rating weighted by the actual number of national<br />
commercial seconds in each minute that passes the number of seconds<br />
qualification.<br />
For example, if there are 45 seconds of commercial activity within a<br />
minute, it will be counted in the NCCM Duration (sec.) as 45 seconds.<br />
Primary Qualified Audience of<br />
Minutes<br />
Progressive Cume<br />
For R&F Duplication reports, you select a primary schedule and a secondary<br />
schedule. This qualifier is the minute qualifier for the primary schedule.<br />
For Reach & Frequency reports, the gain in reach, frequency, and gross rating<br />
points achieved with each additional spot within the schedule.<br />
The sort order is how you would like the build up compiled. Sort order is<br />
applied within each schedule selected and is only available at the detail<br />
level(s).<br />
• Primary Sort - Date, Time, Originator Type, Originator, Program Name,<br />
Ultimate Parent, Parent, Brand, Brand Variant, Viewing Source, and<br />
Feed Pattern.<br />
• Secondary Sort - Originator Type, Originator, Program Name, Ultimate<br />
Parent, Parent, Brand, Brand Variant, Viewing Source, Feed Pattern,<br />
Date, and Time.<br />
Projection<br />
An average audience, expressed in terms of households or persons, derived<br />
by multiplying a rating by the appropriate universe estimate.<br />
Note Does not apply to Convergence Research Panel or Cross-Platform<br />
Homes.<br />
• (000) - Designates that projection results are displayed in thousands.<br />
• Units - Designates that projection results are displayed in units.<br />
<strong>National</strong> <strong>TV</strong> <strong>Toolbox</strong> <strong>User</strong> <strong>Guide</strong> Criteria Selection Page Descriptions • 7-137
Statistic<br />
Qualified Audience of Minutes<br />
Description<br />
For R&F reports, a qualifier is chosen for the schedule, for example, six<br />
minutes. A person who views at least six unique minutes of a program or time<br />
period in the schedule is counted as a viewer of the schedule.<br />
Example<br />
• Qualified Audience = 6 minutes.<br />
• Household or persons watched MOP 1-3 Live and MOP 1-3 playback.<br />
The household or persons would not qualify for Live or playback because they<br />
only viewed 3 unique minutes of each.<br />
To qualify with a 6-minute qualifier, the household or persons must view an<br />
additional 3 minutes of Live or an additional 3 minutes for Live+SD or Live+7<br />
viewing type.<br />
Qualified audience is based on each individual unit. For example, if you have<br />
multiple, one-minute units in a schedule and run a six-minute qualifier for that<br />
schedule, no data is returned because of the qualifier. If you change that sixminute<br />
qualifier to a one-minute qualifier, you get data back.<br />
Reach, Gain/Loss<br />
Reach - The percentage of a given population that is exposed at least once to<br />
a program, network daypart, or advertising schedule. The home or person<br />
must meet certain viewing criteria. For example, the standard qualifier is 6<br />
minutes.<br />
Gain - Gain of audience<br />
Loss - Loss of audience<br />
Secondary Qualified Audience of<br />
Minutes<br />
Set Off/Off Air<br />
Simultaneous Unit Duplication<br />
Only<br />
For R&F Duplication reports, you select a primary schedule and a secondary<br />
schedule. This qualifier is the minute qualifier for the secondary schedule.<br />
For Source & Destination reports, indicates percentage of viewers tuned to the<br />
target MOP/minute who turned their set off during the defined source and<br />
destination shift. Any viewing to an off air network is also included in Set Off.<br />
For R&F Duplication reports, reports simultaneous or concurrent usage of<br />
television and the Internet. See simultaneous usage in the online Glossary.<br />
You can control the schedule to define units by minute. Units can be defined<br />
from one minute through a single reportable day. The units for both schedules<br />
must be built using the same date and time and processed with the same non-<br />
Primary feed pattern.<br />
Note Should be used with Cross-Platform Homes for current data or the<br />
Convergence Research Panel for historical data (May 2008 - November 2009).<br />
Source and Destination Shift<br />
From Target (+\-)(# of minutes)<br />
Minutes<br />
Start Target MOP<br />
For Source & Destination reports, the time shift from the target minute/MOP<br />
used to determine the source and destination viewing source. For a time shift<br />
of five minutes, the source will be what was tuned or viewed five minutes<br />
before the target MOP/minute.<br />
For Source & Destination Program reports, indicates the first MOP displayed<br />
for the program.<br />
Note For Source & Destination Time Period reports, the first minute of the<br />
daypart is the default starting minute of the target.<br />
Criteria Selection Page Descriptions • 7-138<br />
<strong>National</strong> <strong>TV</strong> <strong>Toolbox</strong> <strong>User</strong> <strong>Guide</strong>
Statistic<br />
Sum Combo Viewing Sources<br />
Sum of Sources Distribution %<br />
(SOV)<br />
Description<br />
Sum of all duration-weighted viewing minutes within a daypart to the viewing<br />
sources that make up each combo as defined in the report specification.<br />
Share of viewing is used to examine the viewing from one source (originator,<br />
program, telecast, or viewing source) against the viewing from all other<br />
sources selected for specified dayparts and/or demographics/market breaks.<br />
This is the percentage (%) of viewing distribution to the single sources out of<br />
the sum of all viewing sources selected in the specification.<br />
• Telecast =individual telecast viewing minutes/ total viewing minutes<br />
within a coverage area, market break, demographic<br />
• Program = individual program viewing minutes/total viewing minutes<br />
within a coverage area, market break, demographic, measurement<br />
interval<br />
• Originator = total viewing for originator/total viewing minutes within a<br />
coverage area, market break, demographic, measurement interval<br />
TA Minutes<br />
US AA%<br />
Total Audience Minutes - Optionally designate the minimum number of tuning<br />
minutes required to be included in report results. The default qualifier is 6<br />
minutes.<br />
Total US Average Audience Percent - The number of households tuned to or<br />
persons viewing a program/originator/daypart during the average minute<br />
expressed as a percent of the Total U.S. This is also known as Total U.S.<br />
Rating.<br />
Note Effective 1/31/11, includes duplicate viewing for playback. Effective<br />
4/25/2011, includes any eligible PC contribution for extended screen.<br />
US GAA %<br />
US HUT/PUT and Share %<br />
Total US Gross Average Audience Percent -- The sum of the percent of<br />
households or persons tuning or viewing during the average minute of each<br />
telecast of the program, including repeat telecasts during the report interval.<br />
Duplicated tuning and viewing to the same program (or its repeat telecast) by<br />
the same household during the report period is counted each time.<br />
US HUT/PUT - Total US Households Using Television/Persons Using<br />
Television Percent -- The number of homes (or persons in homes) with<br />
television sets in use expressed as a percent of the Total U.S.<br />
US Share - Total US Share -- The percent of television sets in use (or persons<br />
viewing) that are tuned to a specific program/originator/daypart.<br />
Note Effective 1/31/2011, the HUT definition was changed to households<br />
using television and DVR playback at time of playback.<br />
Use Enhanced Weights<br />
VCR Contribution<br />
VPMH<br />
VPVH<br />
Option to evaluate audience estimates with the upcoming weighting controls.<br />
Household AA% (including VCR record) minus the household AA% (excluding<br />
VCR record).<br />
The number of viewing persons per market breaks household.<br />
The number of viewing persons per tuning household.<br />
<strong>National</strong> <strong>TV</strong> <strong>Toolbox</strong> <strong>User</strong> <strong>Guide</strong> Criteria Selection Page Descriptions • 7-139
Feed Pattern Page<br />
NPOWER & MarketBreaks Reports support a number of feed patterns.<br />
The feed pattern defaults to the primary feed of the viewing source. If a feed pattern is selected for time<br />
period, schedule-based reports, the feed pattern applies to all viewing sources selected for the schedule.<br />
Notes<br />
• When using LPM feed patterns and dayparts, the feed pattern needs to be adjusted. See the <strong>Nielsen</strong><br />
U recorded session on Local Markets.<br />
• For Source & Destination reports, since the entire report is based on the selected feed pattern, the<br />
primary feed pattern is not applicable.<br />
The table below describes the available feed patterns.<br />
Feed Pattern<br />
Primary<br />
Description<br />
Default feed for each network selected.<br />
Note This option is not available for the Source & Destination Time Period<br />
Report.<br />
Broadcast<br />
Dual<br />
Live<br />
NHTI ® Broadcast<br />
Feed specific to broadcast networks and follows the pattern as described in the<br />
NTI Pocketpiece ® , which depends on the dominant distribution times by time<br />
zone.<br />
Programming delivered on both the west and east coasts at the same local<br />
time. For example, a program airing on the east coast at 8 p.m. will also air on<br />
the west coast at 8 p.m. local time.<br />
Programming that is delivered simultaneously regardless of time zone. For<br />
example, a program airing on the east coast at 8 p.m. will air on the west coast<br />
at 5 p.m. local time.<br />
Feed specific to Hispanic broadcast networks.<br />
Criteria Selection Page Descriptions • 7-140<br />
<strong>National</strong> <strong>TV</strong> <strong>Toolbox</strong> <strong>User</strong> <strong>Guide</strong>
Frequency Distribution Page<br />
Frequency distribution is the number or percentage of individuals or households that were re-exposed to a<br />
program, station, or advertisement one time, two times, three times, and so forth, based on the selected<br />
frequency distribution.<br />
Frequency is the average number of times households or persons viewed a given unit (program telecast, a<br />
daypart, or advertisement during a specific time period, such as one month. This number is derived by<br />
dividing the Gross Rating Points (GRP) by the total non-duplicated audience (cume). For example, if a group<br />
of programs achieved 30 GRPs and a cume of 20, then the average frequency would be 1.5 exposures per<br />
person or household.<br />
Page Element<br />
Standard Frequency Distributions<br />
Custom Range<br />
Groups for Frequency Distribution<br />
Current Selections<br />
Description<br />
<strong>Nielsen</strong> NPOWER provides two standard frequency<br />
distribution options.<br />
Enter a start and end range to create a custom<br />
frequency distribution.<br />
Note Leave the second text box empty if you want to<br />
get the + portion of a range. For example, if you enter<br />
20 in the first text box, you will get a custom range of<br />
20+.<br />
Predefined groups of frequency distributions. Click to<br />
display the list.<br />
Frequency distributions you have selected to define<br />
what to extract from the database for your report.<br />
Tip A sum across frequency distributions should match back to the reported AA Reach %.<br />
<strong>National</strong> <strong>TV</strong> <strong>Toolbox</strong> <strong>User</strong> <strong>Guide</strong> Criteria Selection Page Descriptions • 7-141
Report Segment Page<br />
The Report Segment page determines the averaging levels for your report.<br />
For program reports, users can create dynamic averages based on the various options on the page.<br />
The following table provides an alphabetical listing of available report segments, which vary based on report<br />
type.<br />
Segment Report Type Description<br />
Average by the<br />
following<br />
Break on Premiere<br />
Custom LOV/LOT<br />
Events<br />
All<br />
Ratings Analysis Program Report<br />
Trend Analysis Program Report<br />
LOV Program Report<br />
LOT Time Period Report<br />
Indicates what you will get based on the selections<br />
made.<br />
Note You must click ADD for each 'unique' average.<br />
When selected, indicates that season-to-date averages<br />
will be segmented by premiere.<br />
LOV - Defines a custom event duration. Enter a start<br />
and end range of consecutive minutes to create a<br />
custom LOV event.<br />
LOT - Defines a custom event duration. Enter a start<br />
and end range of consecutive minutes to create a<br />
custom LOT event.<br />
Note LOT events at the detail level can be grouped<br />
for later use.<br />
Daily UE and Sample Information Daily UE counts for each day of the measurement<br />
interval.<br />
Day of Week<br />
Daypart<br />
Details<br />
Episode<br />
Detailed Type<br />
Code<br />
Ratings Analysis Program Report<br />
Trend Analysis Program Report<br />
Ratings Analysis Time Period<br />
Report<br />
Trend Analysis Time Period Report<br />
PowerPlay Time Period Report<br />
LOV Program Report<br />
LOT Time Period Report<br />
Ratings Analysis Time Period<br />
Report<br />
Source & Destination Program<br />
Report<br />
Ratings Analysis Program Report<br />
Trend Analysis Program Report<br />
Average by day of the week.<br />
Average whole dayparts.<br />
LOV - Produces a breakout by length of viewing event<br />
for the measurement interval and the selected program.<br />
LOT - Produces a breakout by length of tuning event for<br />
the measurement interval and the selected daypart.<br />
Note An event is consecutive minutes of tuning to a<br />
station.<br />
Activates additional options to create a breakout by<br />
daypart, hour, half hour, quarter hour or minute.<br />
Episode labels in a column on telecast and minute-byminute<br />
reports.<br />
Average by detailed type code.<br />
Criteria Selection Page Descriptions • 7-142<br />
<strong>National</strong> <strong>TV</strong> <strong>Toolbox</strong> <strong>User</strong> <strong>Guide</strong>
Segment Report Type Description<br />
Half Hour<br />
Hour<br />
Ratings Analysis Time Period<br />
Report<br />
PowerPlay Time Period Report<br />
Ratings Analysis Time Period<br />
Report<br />
PowerPlay Time Period Report<br />
Averages by the half hour.<br />
Averages by the hour.<br />
Interval UE and Sample Information Average UE counts across the measurement interval.<br />
LOV/LOT<br />
Standard Events<br />
Minute<br />
Normal Duration<br />
Originator<br />
Program<br />
Program Episode<br />
Program Selection<br />
Program Trackage<br />
LOV Program Report<br />
LOT Time Period Report<br />
Ratings Analysis<br />
PowerPlay<br />
Ratings Analysis Program Report<br />
Trend Analysis Program Report<br />
Ratings Analysis Program Report<br />
Trend Analysis Program Report<br />
Co-Viewing Program Report<br />
LOV Program Report<br />
Ratings Analysis Program Report<br />
Trend Analysis Program Report<br />
Co-Viewing Program Report<br />
LOV Program Report<br />
Ratings Analysis Program Report<br />
Trend Analysis Program Report<br />
Ratings Analysis Program Report<br />
Trend Analysis Program Report<br />
Co-Viewing Program Report<br />
Ratings Analysis Program Report<br />
Trend Analysis Program Report<br />
Co-Viewing Program Report<br />
LOV Program Report<br />
LOV - NPOWER provides standard LOV event<br />
durations in consecutive number of minutes.<br />
LOT - <strong>Nielsen</strong> NPOWER provides standard LOT event<br />
durations in consecutive number of minutes.<br />
Minute-by-minute averages.<br />
Average by the normal duration, which is the usual<br />
span of time a program airs in minutes.<br />
Individual originator averages across the measurement<br />
interval.<br />
Note Originator is always included in the output when<br />
Program, Program Trackage, and/or Program Episode<br />
are selected.<br />
Individual program averages across the measurement<br />
interval.<br />
Individual episode averages across the measurement<br />
interval.<br />
Averages at the Program Selection folder level.<br />
If you select this new report segment, the report<br />
displays Program Selection in your output. It would be<br />
more meaningful to rename the Program Selection<br />
folder in the Current Selections list on the Programs<br />
page to a name that identifies the content.<br />
Individual program trackage averages across the<br />
measurement interval.<br />
<strong>National</strong> <strong>TV</strong> <strong>Toolbox</strong> <strong>User</strong> <strong>Guide</strong> Criteria Selection Page Descriptions • 7-143
Segment Report Type Description<br />
Quarter Hour<br />
Schedule Detail<br />
Schedule Minute<br />
Detail<br />
Schedule<br />
Summary<br />
Source and<br />
Destination<br />
Ratings<br />
Source and<br />
Destination<br />
Distribution<br />
Standard Daypart<br />
Ratings Analysis Time Period<br />
Report<br />
PowerPlay Time Period Report<br />
R & F Report<br />
R & F Duplication Report<br />
R & F Report<br />
R & F Report<br />
R&F Duplication Report<br />
Source & Destination Program<br />
Report<br />
Source & Destination Time Period<br />
Report<br />
Source & Destination Program<br />
Report<br />
Source & Destination Time Period<br />
Report<br />
Ratings Analysis Program Report<br />
Ratings Analysis Time Period<br />
Report<br />
Averages by the quarter hour.<br />
One average for each unit within the schedule.<br />
Minute level average for each unit within the schedule.<br />
One average for all units within the schedule.<br />
Source and destination AAs relative to the source and<br />
destination shift from target with the option to add setoff/off-air<br />
ratings.<br />
Source and destination viewing distributions relative to<br />
the source and destination shift from target with the<br />
option to add set-off/off-air distributions.<br />
Average by standard daypart.<br />
Summary LOT Time Period Report Produces an average length of tuning for the<br />
measurement interval and the selected daypart.<br />
Summary Type<br />
Code<br />
Syndicated AT<br />
Segment<br />
Target Ratings<br />
Telecast<br />
Total Daypart<br />
Trackage<br />
Ratings Analysis Program Report<br />
Trend Analysis Program Report<br />
Ratings Analysis Program Report<br />
Source & Destination Program<br />
Report<br />
Source & Destination Time Period<br />
Report<br />
Ratings Analysis Program Report<br />
Trend Analysis Program Report<br />
PowerPlay Program Report<br />
Ratings Analysis Time Period<br />
Report<br />
Trend Analysis Time Period Report<br />
Source & Destination Program<br />
Report<br />
Average by summary type code.<br />
For Syndicated AT programs, each segment is reported<br />
at the minute level, which adds Telecast ID and TOA<br />
(Type of Airing) columns to the output.<br />
Source and destination Target AA%, Retention %, and<br />
Net Gain/Loss AA% relative to the target with optional<br />
HUT/PUT/Share and/or Commercial/Promo durations at<br />
a minute-by-minute level.<br />
Individual telecast averages.<br />
Daypart averages across the measurement interval.<br />
Provide the trackage name in the output.<br />
Criteria Selection Page Descriptions • 7-144<br />
<strong>National</strong> <strong>TV</strong> <strong>Toolbox</strong> <strong>User</strong> <strong>Guide</strong>
Program Details Page<br />
You can choose additional columns of information to add to your reports by selecting program details.<br />
Program details are various codes, indicators, and other program characteristics you can choose to include<br />
as additional columns of information on your reports. When the Indicators option is selected, all indicators<br />
applicable to that program will be reported in one column.<br />
The following table describes the possible selections on the Program Details page.<br />
Column Label Description<br />
Program<br />
Indicators<br />
Telecast<br />
Indicators<br />
Repeat<br />
Summary Type<br />
Code<br />
Detailed Type<br />
Code<br />
Umbrella (NSS)<br />
Type Code<br />
Gap<br />
Short Duration<br />
Long Term OTO<br />
Episode Name<br />
Trackage Name<br />
Program Feed<br />
Pattern<br />
Program Coverage<br />
Content Duration<br />
Special<br />
Sustainer<br />
Breakout<br />
Program telecasts that have aired previously on the airing network.<br />
A category title assigned to programs that are of the same type. For<br />
example, 'Award Ceremonies.' Click to select program types from the list.<br />
Defines the content of cable telecasts in a more detailed manner. Click to<br />
include expanded program types in your report.<br />
Program lineups containing more than one program element that is<br />
telecast on a single station or multiple stations in a market. The program<br />
elements are not rated individually but as a single entity.<br />
An interruption to a telecast by another so that all minutes of programming<br />
of the original telecast are not contiguous across time.<br />
Programs under five minutes.<br />
Programs that aired beyond a one-week time span, so that the final<br />
processed lineup had to be built by combining a series of one-week span<br />
lineups. Long term programs are frequently movie packages that air over<br />
a series of weeks. Drop (exclude) long term programs if you want to<br />
compare only programs that air in your measurement period.<br />
Labels that identify specific creatives associated with certain telecasts of a<br />
program.<br />
A label assigned to a group of telecasts of a particular program that<br />
represents the way these telecasts are sold. Allows for differentiation of<br />
multiple telecasts of a program within a day or week<br />
Reflects "BCAST" feed for Broadcast or Syndication originators and<br />
reflects "Live" or "Dual" for Cable Originators.<br />
The number of television households that can receive the program over<br />
one or more of the broadcast stations or cable head ends that air the<br />
program, expressed as a percent of Total U.S. television households.<br />
For non-linear programs, the duration excludes traditional commercial<br />
activity that occurs in linear content.<br />
Telecasts defined as a "special" by the originator.<br />
Programs where no national commercials air.<br />
A program that does air at its normal day and time, but there is a drop in<br />
coverage. For example, a drop in coverage can occur when there is<br />
breaking local news that significantly interrupts the regular program.<br />
<strong>National</strong> <strong>TV</strong> <strong>Toolbox</strong> <strong>User</strong> <strong>Guide</strong> Criteria Selection Page Descriptions • 7-145
Column Label Description<br />
Additional<br />
Indicators<br />
Complex Program<br />
Indicator<br />
Movie<br />
Live<br />
Team Sport<br />
Non Commercial<br />
Premiere<br />
Standard Dayparts<br />
First Telecast Date<br />
Indicators<br />
Programs composed from multiple regional airings of varying start times<br />
and/or durations.<br />
Specific creative productions associated with a program or category movie<br />
or movie program.<br />
A program or telecast that occurs as it is being aired simultaneously<br />
across all time zones.<br />
Programs designated as professional team sports programs. This<br />
indicator applies only to baseball, basketball, hockey, and football.<br />
Programs or telecasts that do not include any commercial minutes.<br />
Telecasts that are the first airing of a program for a particular season or<br />
days/times.<br />
The standard daypart assigned to the program.<br />
The first telecast date of a syndicated program that is permitted to air over<br />
an extended period of time across many stations.<br />
A subset of the program indicators that may be used as selection criteria.<br />
Includes: breakouts, premiere, special, gapped, movie, team sports,<br />
repeat and repeat sequence, non-commercial, and complex programming.<br />
• A = Acquired (Program/Episode)<br />
• B = Breakout<br />
• C = Complex<br />
• D = Programs < 5 minutes<br />
• G = Gapped<br />
• L = Live<br />
• M = Movie<br />
• N = Non Commercial<br />
• O = Original (Program/Episode)<br />
• P = Premiere<br />
• R = Repeat<br />
• S = Special<br />
• T = Team Sports<br />
• U = Umbrella<br />
• V = Various (Program/Episode)<br />
• X = Unordered Sustainer<br />
• 1 = Long Term<br />
Start Time<br />
End Time<br />
Days Aired<br />
Station Count<br />
The Eastern equivalent time at which the majority of the stations (based<br />
on coverage) in the country started airing the program.<br />
The Eastern equivalent time at which the majority of the stations (based<br />
on coverage) in the country completed airing the program.<br />
The day(s) of the week on which a program airs.<br />
The number of broadcast stations and cable networks included in the<br />
program audience measurement.<br />
Criteria Selection Page Descriptions • 7-146<br />
<strong>National</strong> <strong>TV</strong> <strong>Toolbox</strong> <strong>User</strong> <strong>Guide</strong>
Column Label Description<br />
Station count Includes:<br />
• stations carrying the broadcast network live feeds.<br />
• delay stations that carry on the live day.<br />
• delay stations that carry the program in the two weeks prior to the<br />
live event.<br />
Number of Weeks<br />
Weeks Aired<br />
Number of weeks during which a syndicated program is permitted to air<br />
across many stations.<br />
The number of weeks within a measurement period that a program aired.<br />
For example, if a program airs five days in one week, but does not air<br />
again in the measurement period, the number of weeks is one. If a<br />
program airs once per week for five weeks, the weeks aired is five.<br />
Weeks aired is always based on a Monday-Sunday week. This is<br />
maintained even if you are using a custom calendar. For example, if you<br />
define a nine-day measurement period of Wednesday through Thursday;<br />
Wednesday through Sunday counts as one week, and Monday through<br />
Thursday count as a second week.<br />
Program ID<br />
Telecast ID<br />
Number of<br />
Programs<br />
Unique number used to identify a specific telecast.<br />
Unique number used to identify a specific telecast.<br />
Number of programs that aired within the measurement period.<br />
Current<br />
Selections<br />
Programs you have selected to define what to extract from the database for your report.<br />
<strong>National</strong> <strong>TV</strong> <strong>Toolbox</strong> <strong>User</strong> <strong>Guide</strong> Criteria Selection Page Descriptions • 7-147
Internet Source Page<br />
The Internet Source page controls the type of Internet usage to include in your cross-platform report.<br />
This page applies to Internet reporting only. <strong>TV</strong> reports will not be impacted by either selection.<br />
<strong>Nielsen</strong> NPOWER currently supports the following two options for Internet-based reports:<br />
Internet Source<br />
Total Internet Usage<br />
Video Streaming Only<br />
Description<br />
Internet navigation (browser-based surfing and<br />
browser-based applications) including video streaming<br />
use. Note This is the default selection for new reports.<br />
Streaming usage, which is Internet-delivered video<br />
watched while online.<br />
Notes<br />
• A subtraction of Video Streaming Only from<br />
Total Internet Usage will not result in an<br />
accurate set of non-streaming usage due to<br />
variations in collection and business rules for<br />
each usage type.<br />
• Video Streaming is not available for Cross-<br />
Platform - Data Fusion in NPOWER.<br />
Criteria Selection Page Descriptions • 7-148<br />
<strong>National</strong> <strong>TV</strong> <strong>Toolbox</strong> <strong>User</strong> <strong>Guide</strong>
Dayparts Page<br />
The Dayparts page is used to define a specific daypart for your time period report.<br />
Page Element<br />
All<br />
M-F<br />
Description<br />
Check box used to select or clear all M-Su check<br />
boxes.<br />
Check box used to select or clear M-F check boxes.<br />
Time of day. Use the arrows or the keyboard to change<br />
the time.<br />
AM or PM selections for the daypart.<br />
Optional Daypart Builder<br />
Check boxes that provide additional options for building<br />
dayparts. You can build dayparts by Day of Week, Hour<br />
of Day, Half Hour of Day, and Quarter Hour of Day.<br />
For example, if you select the M and T check boxes,<br />
when you run the report, you get one row for M and T<br />
combined; however, if you select Day of Week, you get<br />
one row for M and one row for T.<br />
Groups for Dayparts<br />
Current Selections<br />
Predefined groups of dayparts. Click to display list.<br />
Dayparts you have selected to define what to extract<br />
from the database for your report.<br />
<strong>National</strong> <strong>TV</strong> <strong>Toolbox</strong> <strong>User</strong> <strong>Guide</strong> Criteria Selection Page Descriptions • 7-149
Viewing Source Page<br />
A viewing source is a measure of a category of viewing within the total U.S. or the coverage area of the cable<br />
originator being measured.<br />
A viewing source is required for time-period reports and the Source and Destination Program Report.<br />
Page Element<br />
Viewing Source Categories<br />
Viewing Sources<br />
Groups for Viewing Source<br />
Current Selections<br />
Description<br />
The type of viewing source.<br />
The name of the viewing source. This box is populated based on the viewing<br />
source category selected.<br />
Predefined groups of viewing sources. Click to display the list.<br />
Viewing sources you have selected to define what to extract from the database<br />
for your report.<br />
Note Documentation on reportable network day can be found on the <strong>Nielsen</strong> Report Library.<br />
Criteria Selection Page Descriptions • 7-150<br />
<strong>National</strong> <strong>TV</strong> <strong>Toolbox</strong> <strong>User</strong> <strong>Guide</strong>
About Demographics<br />
Demographics are audience classifications that are based on persons age and gender (for example, Females<br />
18-24). After selecting age and gender, you can further narrow the scope of your report by adding specific<br />
person characteristics.<br />
Creating Demographic Groups<br />
You can create or delete your own demographic groups from the Demographics selection tab. Once you<br />
create a demographic group, it remains in your group list until you remove it. You can use the group with any<br />
specification, and you can delete or rename the group as desired. You can also combine demographics to<br />
create custom demographics. Additionally, you can use Boolean logic when specifying demographics of the<br />
same age and gender with different person characteristics.<br />
Note Depending on the report type, demographic groups may not carry over when using the Open Spec As<br />
command on the shortcut menu.<br />
<strong>National</strong> <strong>TV</strong> <strong>Toolbox</strong> <strong>User</strong> <strong>Guide</strong> Criteria Selection Page Descriptions • 7-151
Demographics Page<br />
The demographics page contains everything you need to select demographics or person characteristics for<br />
your reports.<br />
Person characteristics are audience demographic classifications based on age, gender, and optional person<br />
characteristics. You can also combine demographics to create custom person characteristics. Additionally,<br />
you can use Boolean logic when specifying demographics of the same age and gender with different person<br />
characteristics.<br />
The label for the Demographics selection tab varies based on the report typeas described below:<br />
Report Type<br />
Co-Viewing<br />
Demographics Selection Tab Label<br />
Co-View Demographics<br />
Note Does not include an option to select Households.<br />
Length of Tune<br />
Ratings Analysis<br />
Segmentation<br />
Respondent Demographics<br />
Respondent Demographics<br />
Segmentation Demographics<br />
Note One demographic selection is allowed.<br />
Profile Demographics<br />
Used to analyze the profile statistics on the output for the segmentation. This is<br />
a subset of the segmentation demographic that is selected on the<br />
Segmentation Demographics selection tab. Multiple selections are allowed;<br />
however, the selections must fall within the selected segmentation<br />
demographic. For example, if M18-34 is the selected segmentation<br />
demographic, selecting F18-34 as a profile demographic will produce no data.<br />
If a user selects a larger break for the Profile Demo, the larger break will be<br />
automatically cut back to within the segmentation break.<br />
Trend Analysis<br />
Respondent Demographics<br />
Building Block Demographics (for users with MarketBreaks access only)<br />
Page Element<br />
Description<br />
Gender • Persons - men, women, and children<br />
• Females - females only<br />
• Males - males only<br />
• Household - Household represents total households in the sample.<br />
Note If there is no other demographic selected, Household is reported by<br />
default.<br />
Age Range<br />
Start and end age range for person characteristics. Default is 2 - 99. Use the<br />
arrows or the keyboard to change the age range. Ages less than 2 are not<br />
available.<br />
Note MarketBreaks reports use building block demographics; therefore, you<br />
can use the building blocks to create larger groups. For example,<br />
MarketBreaks has building blocks 2-5, 6-8, 9-11, and so forth.<br />
Criteria Selection Page Descriptions • 7-152<br />
<strong>National</strong> <strong>TV</strong> <strong>Toolbox</strong> <strong>User</strong> <strong>Guide</strong>
Optional Person Characteristics - Person characteristics organized into general categories.<br />
Segmentation Characteristics - When a unified sample is selected, this tab is displayed on the Demographics<br />
page. All segmentations tied to the selected unified sample are listed on this tab.<br />
Notes<br />
• Click the column headings to sort in ascending or descending order.<br />
• Household segmentations will be populated if Household is selected on the left.<br />
Report Name<br />
Completed<br />
Segmentation Name<br />
The report name entered on the specification definition page for the<br />
segmentation execution.<br />
The date and time the segmentation execution was completed.<br />
The name applied to the segmentation based on criteria selections made on<br />
the Segmentation page.<br />
Example:<br />
Network A | Persons 2-99 | Composite<br />
Segment The individual segments within the selected segmentation.<br />
Example:<br />
HighFreq(75%)/HighDur(75%)<br />
Groups for Demographics<br />
Current Selections<br />
Predefined groups of demographics. Click to display the list.<br />
Demographics you have selected to define what to extract from the database<br />
for your report.<br />
<strong>National</strong> <strong>TV</strong> <strong>Toolbox</strong> <strong>User</strong> <strong>Guide</strong> Criteria Selection Page Descriptions • 7-153
Co-View Pairs Page<br />
For Co-Viewing reports, the Co-View Pairs page provides a list of viewers that you can compare. The<br />
selections available are based on the demographics selected from the Co-View Demographics page.<br />
Page Element<br />
Primary<br />
Selected<br />
Select All<br />
Secondary<br />
Selected<br />
Select All<br />
Current Selections<br />
Description<br />
Lists the demographics that can be selected as primary demographics in coview<br />
pairs.<br />
Displays the number of demographics currently selected in the primary co-view<br />
list.<br />
Selects all demographics in the primary co-view list or clears all demographic<br />
selections in the primary co-view list.<br />
Lists the demographics that can be selected as secondary demographics in coview<br />
pairs.<br />
Displays the number of demographics currently selected in the secondary coview<br />
list.<br />
Selects all demographics in the secondary co-view list or clears all<br />
demographic selections in the secondary co-view list.<br />
Lists the co-view pairs that you have selected to define what to extract from the<br />
database for your report.<br />
Criteria Selection Page Descriptions • 7-154<br />
<strong>National</strong> <strong>TV</strong> <strong>Toolbox</strong> <strong>User</strong> <strong>Guide</strong>
About Market Breaks<br />
Household characteristics are identified in two ways: market sections and market breaks.<br />
A market section is a general audience that you want to analyze, for example, a geographic territory or a<br />
group of pet owners. Market breaks are specific household characteristics within market sections. For<br />
example, Dog Owners is a market break within the Pet Owners market section.<br />
Market Break Groups<br />
You can create or delete your own market breaks groups from the Market Breaks selection tab. You can also<br />
combine several standard market breaks within a market section to create a custom market break.<br />
Additionally, you can use nested Boolean logic when specifying market breaks.<br />
Once you create a market break group, it remains in your group list until you remove it. You can use the<br />
group with any specification, and you can delete or rename the group as desired.<br />
<strong>National</strong> <strong>TV</strong> <strong>Toolbox</strong> <strong>User</strong> <strong>Guide</strong> Criteria Selection Page Descriptions • 7-155
Market Breaks Page<br />
Market breaks are specific household characteristics within market sections.<br />
The Market Breaks page contains everything you need to select market breaks for your report. You can<br />
combine market breaks to create custom household characteristics, and you can use Boolean logic and<br />
nested Boolean logic when specifying market breaks.<br />
Page Element<br />
Market Sections<br />
Market Breaks<br />
Groups for Market Breaks<br />
Current Selections<br />
Description<br />
The general audience you want to analyze organized<br />
into categories, for example, a specific geographic<br />
Territory or Pet Owners.<br />
Household characteristics within market sections. For<br />
example, Dog Owners is a market break within the Pet<br />
Owners market section.<br />
Predefined groups of market breaks. Click to display the<br />
list.<br />
Market breaks you have selected to define what to<br />
extract from the database for your report.<br />
For segmentation reports, there are two Market Breaks selection pages, as described below:<br />
Report Type<br />
Segmentation<br />
Selection Tab/Page<br />
Segmentation Market Breaks<br />
Note One market break selection is allowed.<br />
Profile Market Breaks<br />
Used to analyze the profile statistics on the output for<br />
the segmentation. This is a subset of the segmentation<br />
market break that is selected on the Segmentation<br />
Market Breaks selection tab. Multiple selections are<br />
allowed; however, the selections must fall within the<br />
selected segmentation market break. For example, if<br />
County Size A is the selected segmentation market<br />
break, selecting County Size B as a profile market<br />
break produces no data.<br />
Note If a user selects a larger break, the larger break<br />
automatically cuts back to within the segmentation<br />
break.<br />
Criteria Selection Page Descriptions • 7-156<br />
<strong>National</strong> <strong>TV</strong> <strong>Toolbox</strong> <strong>User</strong> <strong>Guide</strong>
Custom Coverage Areas Page<br />
A custom coverage area is the geographic area where a broadcast signal can be received.<br />
<strong>Nielsen</strong> NPOWER provides an option to create or delete your own custom coverage area groups. You can<br />
also combine custom coverage areas. Additionally, you can use Boolean logic when specifying custom<br />
coverage areas.<br />
Page Element<br />
Custom Coverage Area<br />
Categories<br />
Custom Coverage Areas<br />
Groups for Custom Coverage<br />
Areas<br />
Current Selections<br />
Description<br />
Custom coverage areas organized into general categories.<br />
Individual custom coverage areas within the general custom coverage area<br />
category.<br />
Predefined groups of custom coverage areas. Click to display the list.<br />
Custom coverage areas you have selected to define what to extract from the<br />
database for your report.<br />
Note Custom coverage areas are used to analyze data for a network in another network's coverage area,<br />
for example, ESPN in the TBS coverage area.<br />
<strong>National</strong> <strong>TV</strong> <strong>Toolbox</strong> <strong>User</strong> <strong>Guide</strong> Criteria Selection Page Descriptions • 7-157
Ranking Page<br />
You can rank statistics on ratings and trend reports.<br />
For Ratings Analysis and Trend Analysis reports, optionally rank multiple statistics based on options such as<br />
originators, market breaks, demographics, measurement intervals, and so forth.<br />
Page Element<br />
Statistics<br />
Rank Within<br />
Precision<br />
Current Selections<br />
Description<br />
Statistics available on which to rank your report.<br />
Basis on which to rank within the statistic selected. For example, you can<br />
determine the ratings rank by daypart across multiple demos and/or market<br />
breaks, which advises where the rank should start over. In other words, for<br />
every change in daypart, restart the rank.<br />
The precision level for the rank. In the event of a tie on rank, the precision level<br />
is used to break the tie.<br />
Rankings you have selected to define what to extract from the database for<br />
your report.<br />
Criteria Selection Page Descriptions • 7-158<br />
<strong>National</strong> <strong>TV</strong> <strong>Toolbox</strong> <strong>User</strong> <strong>Guide</strong>
Format Page<br />
The Format page provides flexible formatting options to customize the view of your report output.<br />
The available options are: Demographics Across, Market Breaks Across, and/or Playback Period Across.<br />
<strong>User</strong>s can apply up to three options to the output.<br />
Note Format and Ranking can not be used together in the same report.<br />
Page Element<br />
Description<br />
Format Output<br />
Demographics Across<br />
Changes the format of output to display selected<br />
demographics across columns instead of using the<br />
standard format of displaying in rows.<br />
Market Breaks Across Changes the format of output to display selected market<br />
breaks across columns instead of using the standard<br />
format of displaying in rows.<br />
Playback Period Across<br />
Changes the format of output to display selected playback<br />
periods across columns instead of using the standard<br />
format of displaying in rows.<br />
Output Type<br />
Current Selections<br />
Provides the option to produce output in .csv format.<br />
Lists the formats that you have selected to for your report.<br />
<strong>National</strong> <strong>TV</strong> <strong>Toolbox</strong> <strong>User</strong> <strong>Guide</strong> Criteria Selection Page Descriptions • 7-159
Criteria Selection Page Descriptions • 7-160<br />
<strong>National</strong> <strong>TV</strong> <strong>Toolbox</strong> <strong>User</strong> <strong>Guide</strong>
Chapter 8<br />
Reach & Frequency Schedules and Reports<br />
Create schedules and run reports based on those schedules to determine the number of households or<br />
persons reached by a schedule and the number of times they were reached.<br />
■<br />
■<br />
■<br />
■<br />
■<br />
■<br />
■<br />
About R&F Reports<br />
About R&F Duplication Reports<br />
Creating Reach & Frequency Reports<br />
About Unification<br />
Creating a Unified Sample<br />
About Schedules<br />
R & F Schedule Definition Page<br />
<strong>National</strong> <strong>TV</strong> <strong>Toolbox</strong> <strong>User</strong> <strong>Guide</strong> Reach & Frequency Schedules and Reports • 8-161
About R&F Reports<br />
The R&F Report is used to provide unduplicated audience estimates and frequency of viewing estimates for<br />
one or a series of selected advertisements, programs, time periods, or Internet sources for various market<br />
breaks and demographics. They can also report the number of telecasts that homes or persons watched of a<br />
particular program during a specified measurement interval.<br />
These studies provide a means to compare and evaluate the effectiveness of advertising or promotional<br />
schedules based on the number of homes or people reached. Reach estimates can be supplemented with<br />
frequency distributions that show the number of times a home or a person was exposed to a national<br />
commercial. Many advertisers believe an average frequency of three or more is needed for advertising to be<br />
considered effective.<br />
Notes<br />
• Internet data is not valid for the household level, it is only available for the person level.<br />
• Effective January 31, 2011, all frequency metrics include duplicate viewing.<br />
• Effective April 25, 2011, these reports no longer use daily custom universe estimates. Universe<br />
estimates are now the sum of unified intab weights for the custom characteristics and the unification<br />
selected.<br />
Reach & Frequency Modifications<br />
Effective with data for February 2011, the following changes were made to the Reach & Frequency suite of<br />
reports in <strong>Nielsen</strong> NPOWER. The modifications were implemented Monday, February 27, 2012 and affect the<br />
NPOWER ® calculated reach and frequency levels for qualified program and time-period audience schedules<br />
only. Some clients utilize these calculations for internal analysis of programming.<br />
Notes The following data and calculations are not affected and did not change:<br />
• Reach & Frequency (R&F) Report calculations based on advertisement or promotional schedules<br />
• All NPOWER program and time-period schedules that were processed on Live-only data<br />
• Commercial, C3 / ACM, ratings, and other reports and statistics available in NPOWER<br />
Enhancements to Calculations<br />
Qualified Program & Time Period Frequency Calculations<br />
Qualified program and time-period schedules for frequency-based metrics are now based on the number of<br />
different content minutes viewed that pass the selected qualifier. This change ensures that these breaks in<br />
linear viewing are not counted as additional frequencies of viewing when the fast-forward, rewind, and pause<br />
functions are used during DVR playback using a DVR or VOD.<br />
Note Frequency-based statistics include: Qualified GRP % / (000) and Frequency Distribution if selected.<br />
Qualified Program & Time Period Reach & Frequency Schedules Calculations<br />
Qualified reach and frequency is now based on distinct/unique minutes, and repeat viewing of the same<br />
minutes does not count toward meeting the cume qualifier. Prior to this change, for data beginning February<br />
2011, the data was based on "ANY" minutes, even if the same content minute was viewed six times. This<br />
change ensures that these breaks in linear viewing are not counted as additional frequencies of viewing for a<br />
telecast when calculated in NPOWER when the fast-forward, rewind, and pause functions are used during<br />
DVR playback using a DVR or VOD.<br />
This enhancement is also implemented on the R&F Duplication reports for the reach metrics.<br />
Note This does not apply to reports using a one-minute qualifier.<br />
New Apply Distinct Processing Option<br />
When selected, this option processes Average Frequency and Average Minutes without duplicate viewing. By<br />
selecting the "Apply Distinct Processing" option on the Statistics page, users who do programming research<br />
Reach & Frequency Schedules and Reports • 8-162<br />
<strong>National</strong> <strong>TV</strong> <strong>Toolbox</strong> <strong>User</strong> <strong>Guide</strong>
are now able to analyze how many different episodes of a series a viewer watched. <strong>User</strong> Preferences now<br />
provides the option to set this as the default reach and frequency methodology if desired.<br />
Notes<br />
• Advertisement schedules should always be evaluated with the default frequency methodology (without<br />
the Apply Distinct Processing option selected), which counts any repeat viewing of commercial<br />
minutes.<br />
• Frequency-based statistics include: Qualified GRP % / (000) and Frequency Distribution if selected.<br />
• Average minute-based statistics include: Spot GRP % / (000.)<br />
<strong>National</strong> <strong>TV</strong> <strong>Toolbox</strong> <strong>User</strong> <strong>Guide</strong> Reach & Frequency Schedules and Reports • 8-163
About R&F Duplication Reports<br />
The R&F Duplication Report analyzes the viewing of schedule pairs and determines the additional viewers<br />
reached by combining them. This report calculates the number of households or persons reached by each<br />
schedule separately, by a combination of the schedules, and the number reached by both schedules.<br />
This report helps answer the following questions:<br />
• What else do viewers of my network watch?<br />
• On what network and time should I promote my programs, and how much duplication of viewers<br />
exists?<br />
• Where is the target audience located?<br />
• On what particular network or in what particular time period should I advertise to be the most<br />
effective?<br />
• Am I bringing in new viewers across my programming or are they the same viewers viewing different<br />
shows?<br />
• To what extent are <strong>TV</strong> and Internet used simultaneously?<br />
Notes<br />
• You must create unified samples and schedules prior to creating a R&F Duplication Report.<br />
• Internet data is not valid for the household level, it is only available for the person level.<br />
• Simultaneous unit duplication for cross-platform reporting should be used with Cross-Platform Homes<br />
for current data or the Convergence Research Panel for historical data (May 2008 - November 2009).<br />
• Effective April 25, 2011, these reports no longer use daily custom universe estimates. Universe<br />
estimates are now the sum of unified intab weights for the custom characteristics and unification<br />
selected.<br />
Enhancements to Calculations<br />
Effective with data for February 2011, the following changes were made to the Reach & Frequency suite of<br />
reports in <strong>Nielsen</strong> NPOWER. The modifications were implemented Monday, February 27, 2012.<br />
Qualified Program & Time Period Reach & Frequency Schedules Calculations<br />
Qualified reach and frequency is now based on distinct/unique minutes, and repeat viewing of the same<br />
minutes does not count toward meeting the cume qualifier. Prior to this change, for data beginning February<br />
2011, the data were based on "ANY" minutes, even if the same content minute was viewed six times. This<br />
change ensures that these breaks in linear viewing are not counted as additional frequencies of viewing for a<br />
telecast when calculated in NPOWER when the fast-forward, rewind, and pause functions are used during<br />
DVR playback using a DVR or VOD.<br />
This enhancement is also implemented on the R&F Duplication reports for the reach metrics.<br />
Note This does not apply to reports using a one-minute qualifier.<br />
Reach & Frequency Schedules and Reports • 8-164<br />
<strong>National</strong> <strong>TV</strong> <strong>Toolbox</strong> <strong>User</strong> <strong>Guide</strong>
Creating Reach & Frequency Reports<br />
There are three steps necessary to create Reach & Frequency reports.<br />
Follow the steps below to create your reports.<br />
To …<br />
Create your unified samples.<br />
Build your schedules.<br />
Run the report.<br />
Do the following …<br />
a. From the <strong>National</strong> <strong>TV</strong> <strong>Toolbox</strong> home page navigation pane, under<br />
Unification, select the Unification report type.<br />
b. Click New.<br />
c. Make selections, as desired, from the selection tabs.<br />
d. Click Submit.<br />
a. From the <strong>National</strong> <strong>TV</strong> <strong>Toolbox</strong> home page navigation pane, under<br />
the Reach & Frequency Schedules folder select the type of schedule<br />
you wish to create.<br />
b. Click New.<br />
c. Make selections, as desired, from the selection tabs.<br />
d. Click Submit.<br />
a. From the <strong>National</strong> <strong>TV</strong> <strong>Toolbox</strong> home page navigation pane, under<br />
the Reach & Frequency Reports folder select R&F Report or R&F<br />
Duplication Report.<br />
b. Click New.<br />
c. Make selections, as desired, from the selection tabs.<br />
d. Click Submit.<br />
<strong>National</strong> <strong>TV</strong> <strong>Toolbox</strong> <strong>User</strong> <strong>Guide</strong> Reach & Frequency Schedules and Reports • 8-165
About Unification<br />
The <strong>Nielsen</strong> Company's estimates are based on a dynamic sample of households. The number of unique<br />
households in our system is never the same from day-to-day. Some homes are added and some homes are<br />
removed daily, based on the length of time the homes have been in the sample. Because of this constant<br />
movement, some viewers may only have had the opportunity to view the last few days of a week or month,<br />
while others may have been able to view the entire month.<br />
Since reach measures the population that was exposed to an advertisement, program, or time period, we<br />
want to make sure everyone in the population had an equal opportunity to view; therefore, prior to creating<br />
Reach & Frequency or Segmentation reports, you must run a Unification report. Unification is the process<br />
used to produce a sub-sample or a unified sample of usable people meter homes for a specified<br />
measurement period. Unification places restrictions on the homes included in a sample. Only homes that<br />
provide usable information, referred to as intab, that meet the minimum requirements for at least X% of the<br />
days in the measurement interval are included.<br />
Unification types are:<br />
• Standard Unification - Day, Week, Month, or Quarter<br />
• Custom Unification - Percentage (required for all non-standard unification)<br />
Note Standard unification types are based on the NTI and NHI <strong>Nielsen</strong> Calendar: Day, Week, Month, or<br />
Quarter. Custom unification applies to any date range. NHI standard unification availability is from June 30,<br />
2008 forward (July).<br />
Standard Unification Rules<br />
Visitors are not included in the unification process. Households can be intab even if the persons in the<br />
households are not intab. The unification rules are as follows:<br />
• Daily Unification - A person or household must be intab on the date selected for the measurement<br />
interval. You select a one-day measurement date. If more than one day is selected, it must be<br />
scheduled as recurring daily.<br />
• Weekly Unification - A person or household must be intab at least five out of seven days in a <strong>Nielsen</strong><br />
Media week, and Saturday and Sunday must be intab. You select a one-week measurement interval<br />
that must start on a Monday and last seven days. If more than one week is selected, it must be<br />
scheduled as recurring weekly.<br />
• Monthly Unification<br />
• Four-week month - A person or household must be intab at least 21 out of 28 days with at least<br />
three instances of each day of the week (Monday - Sunday) intab. If more than one month is<br />
selected, it must be scheduled as recurring monthly.<br />
• Five-week month- A person or household must be intab at least 26 out of 35 days with at least<br />
three instances of each day of the week (Monday - Sunday) intab. If more than one month is<br />
selected, it must be scheduled as recurring monthly.<br />
• Quarterly Unification<br />
• Thirteen-week quarter - A person or household must be intab at least 68 out of 91 days with at<br />
least nine instances of each day of the week (Monday - Sunday) intab. If more than one quarter is<br />
selected, it must be scheduled as recurring quarterly.<br />
• Fourteen-week quarter - A person or household must be intab at least 74 out of 98 days with at<br />
least 10 instances of each day of the week (Monday - Sunday) intab. If more than one quarter is<br />
selected, it must be scheduled as recurring quarterly.<br />
• Fifteen-week quarter - A person or household must be intab at least 79 out of 105 days with at<br />
least 11 instances of each day of the week (Monday - Sunday) intab. If more than one quarter is<br />
selected, it must be scheduled as recurring quarterly.<br />
Note When creating standard unification, the unification selected must match the measurement<br />
interval. For example, you cannot select monthly unification and then select a week for the<br />
measurement interval.<br />
Reach & Frequency Schedules and Reports • 8-166<br />
<strong>National</strong> <strong>TV</strong> <strong>Toolbox</strong> <strong>User</strong> <strong>Guide</strong>
Tip Unification can be set up as a recurring report.<br />
Custom Unification Rules<br />
Percent unification is computed as a straight percentage of the number of days that households or persons<br />
are intab, divided by the total number of days in the measurement interval.<br />
Example:<br />
<strong>National</strong> <strong>TV</strong> <strong>Toolbox</strong> <strong>User</strong> <strong>Guide</strong> Reach & Frequency Schedules and Reports • 8-167
Creating a Unified Sample<br />
A unified sample is the subsample created by running criteria for the unification. Selection of a unified sample<br />
is required for some reports and optional for others.<br />
1. From the <strong>National</strong> <strong>TV</strong> <strong>Toolbox</strong> home page navigation pane, select the Unification report type, and<br />
then click New.<br />
2. From the Specification Definition page, type a name in the Report Name box.<br />
Note The Report Name you assign becomes a selection in the Unified Sample list in other reports;<br />
therefore, be sure the Report Name clearly identifies the content of the unified sample.<br />
3. Click the title bar of the Sample selection tab.<br />
4. From the Sample selection page, make your selection, and then click Next Page to move to the next<br />
step in sequence.<br />
5. From the Measurement Interval page, select a measurement interval, and then click Next Page to<br />
move to the next step in sequence.<br />
6. From the Unification page, select a unification type.<br />
Note If Standard unification is selected, the unification type must match the measurement interval.<br />
For example, if you use the week selector to select a week on the measurement interval page, you<br />
must select a standard unification of Week.<br />
7. Click the Specification Definition bar to return to the Specification Definition page.<br />
8. Click Submit to submit the request.<br />
Reach & Frequency Schedules and Reports • 8-168<br />
<strong>National</strong> <strong>TV</strong> <strong>Toolbox</strong> <strong>User</strong> <strong>Guide</strong>
About Schedules<br />
Prior to creating Reach & Frequency reports, you must build your schedules. A schedule is a list of specific<br />
minutes in a program telecast, a time-period daypart, an advertisement, or daypart for an Internet source.<br />
The purpose of Reach & Frequency schedule-based reports is to analyze the number of households or<br />
persons reached by a schedule. The report can be run for a single schedule or for multiple schedules at the<br />
same time.<br />
There are four types of schedules in <strong>Nielsen</strong> NPOWER and an option to upload custom schedules:<br />
• Advertiser-based schedules - contain exact national commercial minutes with advertisements that<br />
aired in programs during the measurement interval for the selected advertiser, brand, or brand variant.<br />
• Program-based schedules - contain selected minutes of programs that aired during the measurement<br />
interval. You may also choose to include only the minutes of the program that aired a national<br />
commercial.<br />
• Time Period-based schedules - contain selected minutes of time-period dayparts for viewing sources<br />
during the measurement interval.<br />
• Internet-based schedules (subscription based) - contain selected minutes of dayparts for Internet<br />
sources during the measurement interval.<br />
• Custom Upload schedules - contain selected minutes of time period or program sources during a<br />
measurement interval.<br />
Note For assistance with upload schedules, contact your <strong>Nielsen</strong> Client Services Representative.<br />
<strong>National</strong> <strong>TV</strong> <strong>Toolbox</strong> <strong>User</strong> <strong>Guide</strong> Reach & Frequency Schedules and Reports • 8-169
R & F Schedule Definition Page<br />
The R&F Schedule Definition Page contains everything you need to view, filter, and/or<br />
customize your schedules.<br />
The table below describes the elements of the page:<br />
Page Element<br />
Schedule Name<br />
Description<br />
The name of the schedule currently selected and displayed in the grid.<br />
Click the drop-down arrow to display the schedules included in this report<br />
request.<br />
[n]<br />
The number in parentheses indicates the number schedules included in this<br />
report request.<br />
Click this to save all changes made on the page to the current schedule.<br />
Note If you rename the schedule and then click Save, the original schedule<br />
is renamed.<br />
Rename Schedule<br />
Use this text box to rename a schedule.<br />
Rename the schedule and then click this to create a copy of the schedule with<br />
a different name.<br />
Units<br />
The row above the grid provides tools for selecting and filtering, as well as<br />
summary information. The grid displays unit information on the left and minute<br />
information for the selected unit on the right.<br />
Include All Units. Click this to select all check boxes in the Units Included<br />
column with one click.<br />
Exclude All Units. Click this to clear all check boxes in the Units Included<br />
column with one click.<br />
Selected Units<br />
Selected Minutes<br />
The total number of units in the schedule and the number of units in the<br />
schedule that are currently selected.<br />
The total number of selected minutes for all units.<br />
Click this to display the Filter Current Schedule pop-up window.<br />
Note You must close the pop-up window to continue working in <strong>Nielsen</strong><br />
NPOWER.<br />
Minutes<br />
The right panel of the grid displays minute information for the selected unit.<br />
Note The asterisks indicate national commercial minutes.<br />
Include Selected Minutes. Click this to select check boxes for the currently<br />
highlighted minutes with one click.<br />
Tip Press Shift+click to select adjacent minutes or Ctrl+click to select nonadjacent<br />
minutes.<br />
Exclude Selected Minutes. Click this to select check boxes for the currently<br />
highlighted minutes with one click.<br />
Tip Press Shift+click to select adjacent minutes or Ctrl+click to select nonadjacent<br />
minutes.<br />
Reach & Frequency Schedules and Reports • 8-170<br />
<strong>National</strong> <strong>TV</strong> <strong>Toolbox</strong> <strong>User</strong> <strong>Guide</strong>
Chapter 9<br />
Working with Schedules<br />
A schedule is a listing of specific minutes for a program telecast, a time-period daypart, an advertisement, or<br />
a daypart for an Internet source that you want to evaluate. Before you create Reach & Frequency reports,<br />
you must build your schedules.<br />
■<br />
■<br />
■<br />
■<br />
■<br />
■<br />
Building Schedules<br />
Viewing or Editing a Schedule<br />
Applying a Filter to a Schedule<br />
Deleting a Schedule Execution<br />
Deleting All Schedule Executions<br />
Deactivating a Single Schedule within an Execution<br />
<strong>National</strong> <strong>TV</strong> <strong>Toolbox</strong> <strong>User</strong> <strong>Guide</strong> Working with Schedules • 9-171
Building Schedules<br />
A schedule is a listing of minutes in which an advertisement aired or a listing of minutes within a program<br />
telecast, time period daypart, or advertisement. Schedule building is about how those minutes are selected to<br />
create the appropriate list of minutes for the type of report in which the schedule will be used.<br />
The schedules you build are based on the criteria selections you make on the schedule Specification<br />
Definition page, which follow a hierarchical view. You must define your schedules, then you define how you<br />
want to build your units, as well as which minutes you want to analyze within each unit.<br />
Note Selections made on the Schedule page determine how many schedules are built, how the minutes<br />
are broken out into units, and which minutes within those units are selected.<br />
1. From the <strong>National</strong> <strong>TV</strong> <strong>Toolbox</strong>home page, select one of the following:<br />
• R&F Advertisement Schedule<br />
• R&F Program Schedule<br />
• R&F Time Period Schedule<br />
• R&F Internet Schedule<br />
2. Click New.<br />
3. From the Specification Definition page, type a name for the schedule in the Report Name box.<br />
4. Click the title bar of the Sample selection tab.<br />
5. From the Sample selection page, make your selection, and then click Next Page to move to the<br />
Measurement Interval page.<br />
6. Select your measurement interval, and then click Add to add it to the Criteria Selection pane.<br />
7. Click Next Page to move to the Schedule page.<br />
8. From the Schedule page, make selections as desired.<br />
Note Selections made on the Schedule page determine how many schedules are built, how the<br />
minutes are broken out into units, and which minutes within those units are selected.<br />
9. Do one of the following:<br />
• Click Next Page to move to the next step in sequence.<br />
• Click the Specification Definition bar to return to the Specification Definition page.<br />
10. When you have completed your selections, do one of the following:<br />
• Click Save to save the schedule specification without building the schedules.<br />
• Click Submit to submit the request to build the schedule(s).<br />
Working with Schedules • 9-172<br />
<strong>National</strong> <strong>TV</strong> <strong>Toolbox</strong> <strong>User</strong> <strong>Guide</strong>
Viewing or Editing a Schedule<br />
<strong>Nielsen</strong> NPOWER provides a schedule editing tool that is available from the <strong>National</strong> <strong>TV</strong> <strong>Toolbox</strong> home page<br />
after your schedules are built.<br />
1. From the <strong>National</strong> <strong>TV</strong> <strong>Toolbox</strong> home page navigation pane, select the type of schedule you wish to<br />
edit.<br />
2. Click the Edit Schedules icon in the Report Output column to the right of the schedule you wish to<br />
edit.<br />
3. From the R&F Schedule Definition page, click the drop-down arrow to the right of<br />
Schedule Name.<br />
4. Select a schedule from the drop-down list.<br />
The grid populates with unit details for the selected schedule.<br />
5. From the grid, select a unit (row) in the grid to display the active minutes within the unit.<br />
6. Select or clear check boxes in the Included columns for units or minutes, as desired.<br />
7. Click the Specification Definition bar at the bottom of the page to view the original schedule<br />
specification.<br />
Note If you make changes to the original schedule specification, you must resubmit the schedule<br />
request.<br />
8. Click the R&F Schedule Definition bar to return to the schedule editor grid.<br />
9. Edit your schedule as desired, and then do one of the following:<br />
• Click Save to save the changes to the name in the Schedule Name box.<br />
• Highlight the schedule name to the right of Rename Schedule, type a new name, and then click<br />
Save As to save the changes to a new schedule.<br />
Note If you do not rename the schedule, the original is overwritten.<br />
<strong>National</strong> <strong>TV</strong> <strong>Toolbox</strong> <strong>User</strong> <strong>Guide</strong> Working with Schedules • 9-173
Applying a Filter to a Schedule<br />
The Schedule Definition page provides a Filter button that allows you to filter a schedule by Date, Day of the<br />
Week, Standard Daypart, Originator Type, Originator, Program, Start Time, End Time, MOPS, or selected<br />
MOPS.<br />
1. From the <strong>National</strong> <strong>TV</strong> <strong>Toolbox</strong> home page navigation pane, select the type of schedule you wish to<br />
filter.<br />
2. Click Edit Schedules in the Report Output column to the right of the schedule you wish to filter.<br />
3. From the R&F Schedule Definition page, click the drop-down arrow to the right of<br />
Schedule Name.<br />
4. Select a schedule from the drop-down list.<br />
5. Click Filter.<br />
The Edit Current Schedule pop-up window displays a list box for each field that can be filtered. All<br />
possible selections within each field are displayed in the list for the specific schedule.<br />
6. Make selections as desired, and then do one of the following:<br />
• Click Apply to close the Edit Current Schedule pop-up window and apply your filter selections to<br />
the schedule.<br />
• Click Cancel to close the Edit Current Schedule pop-up window and without applying your filter<br />
selections to the schedule.<br />
• Click Reset to reset the Edit Current Schedule pop-up window.<br />
7. When you have finished making changes, do one of the following:<br />
• Highlight the schedule name to the right of Rename Schedule, type a new name for the<br />
schedule, and then click Save to save the changes to the name that displays in the Rename<br />
Schedule box. If you did not rename it, the original schedule will be overwritten..<br />
• Click Save As to save a copy of the schedule with the new name.<br />
Working with Schedules • 9-174<br />
<strong>National</strong> <strong>TV</strong> <strong>Toolbox</strong> <strong>User</strong> <strong>Guide</strong>
Deleting a Schedule Execution<br />
You delete a single schedule execution from the <strong>National</strong> <strong>TV</strong> <strong>Toolbox</strong> home page just like you delete any<br />
other report specification. When you delete the execution, all schedules generated within that execution are<br />
also deleted. The original saved specification is not deleted.<br />
1. From the <strong>National</strong> <strong>TV</strong> <strong>Toolbox</strong> home page navigation pane, select the type of schedule you wish to<br />
delete.<br />
2. Click the Jobs tab to display schedule executions.<br />
3. Select the schedule execution you wish to delete.<br />
4. Click Delete.<br />
5. Click OK to confirm.<br />
<strong>National</strong> <strong>TV</strong> <strong>Toolbox</strong> <strong>User</strong> <strong>Guide</strong> Working with Schedules • 9-175
Deleting All Schedule Executions<br />
When you delete a saved specification from the Job Specifications grid, all execution records of that<br />
specification are also deleted. That means all schedule execution records of that specification and all<br />
recurring report records for that specification are deleted.<br />
1. From the <strong>National</strong> <strong>TV</strong> <strong>Toolbox</strong> home page navigation pane, select the type of schedule you wish to<br />
delete.<br />
2. Click the Job Specifications tab to display saved report specifications.<br />
3. Select the schedule specification you wish to delete.<br />
4. Click Delete.<br />
5. Click OK to confirm<br />
Working with Schedules • 9-176<br />
<strong>National</strong> <strong>TV</strong> <strong>Toolbox</strong> <strong>User</strong> <strong>Guide</strong>
Deactivating a Single Schedule within an Execution<br />
You cannot delete a single schedule within a schedule execution; however, you can deactivate a schedule<br />
within an execution.<br />
1. From the <strong>National</strong> <strong>TV</strong> <strong>Toolbox</strong> home page navigation pane, select the type of schedule you wish to<br />
edit.<br />
2. Click Edit Schedules in the Report Output column to the right of the schedule you wish to edit.<br />
3. From the R&F Schedule Definition page, click the drop-down arrow to the right of<br />
the Schedule Name.<br />
4. Select the schedule you wish to deactivate from the drop-down list.<br />
The grid populates with unit details for the selected schedule.<br />
5. From the schedule editor grid, click Exclude All Units to clear the check box to the left of each unit.<br />
6. Do one of the following:<br />
• Click Save to overwrite the existing schedule with your changes.<br />
• Type a new name in the Rename Schedule box, and then click Save As to retain the original<br />
schedule and save the changes to a renamed copy of the schedule.<br />
<strong>National</strong> <strong>TV</strong> <strong>Toolbox</strong> <strong>User</strong> <strong>Guide</strong> Working with Schedules • 9-177
Working with Schedules • 9-178<br />
<strong>National</strong> <strong>TV</strong> <strong>Toolbox</strong> <strong>User</strong> <strong>Guide</strong>
Chapter 10<br />
Segmentation Analyses<br />
These analyses expand the level of understanding of the dynamics of the network's audience to help<br />
determine who the core viewers are and the profile of the viewers.<br />
■<br />
■<br />
■<br />
About Segmentation Reports<br />
Using Segmentations in Other Reports<br />
Segmentation Reports<br />
<strong>National</strong> <strong>TV</strong> <strong>Toolbox</strong> <strong>User</strong> <strong>Guide</strong> Segmentation Analyses • 10-179
About Segmentation Reports<br />
<strong>Nielsen</strong> NPOWER segmentation reports provide subsample selection based on viewing. This capability helps<br />
you identify the heavy viewers of a network as well as groups of lighter viewers. Viewers of selected<br />
programs or time-period viewing sources are then classified into segments based on viewing behavior.<br />
These analyses expand the level of understanding of the dynamics of the network's audience to help<br />
determine who the core viewers are and the profile of the viewers.<br />
Segmentation can be based on a program, a network, or a combination of networks. For time-based viewing,<br />
a time of day and feed pattern must also be identified (such as 4-6P Live). All data is multi-processed at a<br />
household/person level.<br />
Segmentation analyses can answer the following questions:<br />
• Who are my heavy or light viewers?<br />
• Do my heavy or light viewers change over time?<br />
• To what extent do my heaviest viewers drive my numbers?<br />
• Are the heavy viewers' profiles similar to the overall networks' viewer profiles?<br />
• What are the differences between my heavy and light viewers?<br />
• Where can light viewers be reached?<br />
• What other networks do my core viewers watch?<br />
• How does viewing to my original programming differ from viewing to acquired programming?<br />
Types of segmentation reports available include the following:<br />
• Quad Segmentation - separates viewers based on frequency and duration to determine loyal viewers.<br />
• NTile Segmentation - divides viewing households/persons or Internet source users into even groups to<br />
rank your <strong>TV</strong> viewers/Internet users.<br />
• Number of Minutes Segmentation - divides viewers into two groups (top viewers or bottom viewers)<br />
based on whether they met the qualifier.<br />
• Number of Seconds/PVs Internet Segmentation - divides Internet users into two groups (top Internet<br />
users or bottom Internet users) based on number of seconds or number of page views requested.<br />
Note After segmentations are run, the results can be used to feed into other reports.<br />
Segmentation Analyses • 10-180<br />
<strong>National</strong> <strong>TV</strong> <strong>Toolbox</strong> <strong>User</strong> <strong>Guide</strong>
Using Segmentations in Other Reports<br />
Some reports provide the ability to further refine results by adding segmentation characteristics.<br />
You can select a unified sample from the Demographics page by clicking the Segmentation Characteristics<br />
tab. You can also select optional segmentation demographics in Reach & Frequency Reports the same way;<br />
when a unified sample is selected, additional Segmentation Characteristics are displayed for pre-run<br />
segmentations based on the unified sample selected.<br />
Notes<br />
• Household segmentations are populated if Household is selected on the left.<br />
• The Report Name column displays the Report Name applied when the segmentation was created.<br />
<strong>National</strong> <strong>TV</strong> <strong>Toolbox</strong> <strong>User</strong> <strong>Guide</strong> Segmentation Analyses • 10-181
Segmentation Reports<br />
<strong>Nielsen</strong> NPOWER provides a number of segmentation reports to analyze viewing.<br />
About Quad Segmentation<br />
The Quad Segmentation reports let you identify viewers based on frequency of viewing and duration.<br />
• Low Frequency-High Duration<br />
• High Frequency-High Duration<br />
• Low Frequency-Low Duration<br />
• High Frequency-Low Duration.<br />
Quads have two calculations: frequency and duration. Households or persons are determined to be in a<br />
quadrant based on the frequency of their viewing and the duration of their viewing.<br />
Frequency Percent of Days<br />
Time-based quad reports use intab days with viewing, divided by the total number of intab days for the<br />
measurement interval. Program-based quad reports use intab telecast days with viewing, divided by the total<br />
number of intab telecast days for the measurement interval.<br />
Duration - Number of Minutes Viewed<br />
The second calculation is average minutes. For time period reports, the calculation is total viewing minutes<br />
divided by the number of intab days with viewing. For program reports, the calculation for average minutes is<br />
total viewing minutes divided by the number of intab telecast days with viewing.<br />
Based on these two calculations, a household or person is assigned to one of the following quadrant<br />
segmentations:<br />
Usage<br />
Quads are best suited to measure loyalty within programs, not generic dayparts. This assists with identifying<br />
core program viewers based on duration and frequency.<br />
Segmentation Analyses • 10-182<br />
<strong>National</strong> <strong>TV</strong> <strong>Toolbox</strong> <strong>User</strong> <strong>Guide</strong>
Suggested Parameters<br />
About NTile Segmentation<br />
NTile Segmentation reports let you rank viewing from highest to lowest and divide viewing households or<br />
persons into 2 - 20 even groups.<br />
There are two reporting levels for NTiles: total minutes and average minutes.<br />
Total Minutes<br />
Households or persons are ranked in order of total minutes viewed. Non-viewers are reported separately.<br />
The households or persons viewing are then divided into the number of tiles specified when defining the<br />
NTile criteria.<br />
Average Minutes<br />
Average NTiles use minutes divided by intab days during the measurement interval for both time period and<br />
program telecasts. The households or persons are ranked in order of average minutes viewed. Non-viewers<br />
are reported separately. Viewers with less than one minute on average are ranked at the bottom. They are<br />
then divided into the number of tiles specified when defining the NTile criteria.<br />
Usage<br />
Historically, NTiles have been used for broader sources or dayparts.<br />
Note For subscribers, an Internet NTile Segmentation is available for reporting persons usage to Internet<br />
sources for either Cross-Platform - Single Source or Cross-Platform - Data Fusion.<br />
About Number of Minutes Segmentation<br />
In this segmentation, the viewers are divided based on a qualifier for minimum number of total minutes,<br />
average minutes, or percent of minutes viewed.<br />
The Number of Minutes Segmentation reports let you divide viewers into two groups from highest to lowest<br />
based on minutes requested (top viewers or bottom viewers). Viewers meeting the number of minutes<br />
qualifier are reported in the top viewers. Those viewers not meeting the minimum viewing qualifier are<br />
reported in the bottom viewers, and non-viewers are reported separately.<br />
<strong>National</strong> <strong>TV</strong> <strong>Toolbox</strong> <strong>User</strong> <strong>Guide</strong> Segmentation Analyses • 10-183
Total Minutes<br />
The households or persons viewing are divided into top viewers and bottom viewers based on the sum of<br />
total minutes viewed.<br />
Average Minutes<br />
The households or persons viewing are divided into top viewers and bottom viewers based on average<br />
minutes viewed, which are the total minutes divided by intab days during the measurement interval for both<br />
time period and program telecast.<br />
Percent of Minutes<br />
The households or persons viewing are divided into top viewers and bottom viewers based on the percent of<br />
minutes viewed, which are the total minutes divided by the number of minutes the respondent had the<br />
opportunity to view (daypart or program duration).<br />
Usage<br />
Number of minutes can identify viewers who might be considered 'qualified' based on a minimum number of<br />
minutes watched of a program. Use this option to identify core program viewers based on the 'qualified'<br />
minutes. You can use this selection to examine all viewers to a source or program by choosing one minute or<br />
more. You can also examine all households viewing a minimum number such as six, which is used for a total<br />
audience rating.<br />
About Number of Seconds/PVs Internet Segmentation<br />
In this segmentation, the users are divided based on a qualifier for minimum number of total seconds,<br />
average seconds, or number of page views.<br />
The Number of Seconds/PVs Internet Segmentation subscription-based report lets you divide Internet users<br />
into two groups from highest to lowest based on seconds requested (top Internet users or bottom Internet<br />
users). Internet users meeting the qualifier are reported in the top Internet users. Those users not meeting<br />
the minimum Internet usage qualifier are reported in the bottom users, and non-users are reported<br />
separately.<br />
Total Seconds<br />
Internet users are divided into top Internet users and bottom Internet users based on the sum of total seconds<br />
of Internet use.<br />
Average Seconds<br />
Internet users are divided into top Internet users and bottom Internet users based on average seconds of<br />
Internet use, which are the total seconds divided by intab days during the measurement interval for the<br />
daypart.<br />
Page Views<br />
Internet users are divided into top Internet users and bottom Internet users based on number of page hits.<br />
Note This option is only used for qualifying users and is not a statistic that is reported.<br />
Usage<br />
This report can identify Internet users who might be considered 'qualified' based on a minimum number of<br />
seconds of Internet usage or number of page views. Use these options to identify core users based on<br />
meeting the qualifier. You can also use this report to examine all Internet users to an Internet source by<br />
choosing one second or one page view as the qualifier.<br />
Note Internet data is not valid for the household level, it is only available for the person level.<br />
Segmentation Analyses • 10-184<br />
<strong>National</strong> <strong>TV</strong> <strong>Toolbox</strong> <strong>User</strong> <strong>Guide</strong>
Chapter 11<br />
Working with Reports<br />
After you create a report specification and generate a report, you can access and work with the saved reports<br />
from the <strong>National</strong> <strong>TV</strong> <strong>Toolbox</strong> home page.<br />
■<br />
■<br />
■<br />
Checking Report Status<br />
Viewing a Report<br />
Modifying Recurring Reports<br />
<strong>National</strong> <strong>TV</strong> <strong>Toolbox</strong> <strong>User</strong> <strong>Guide</strong> Working with Reports • 11-185
Checking Report Status<br />
The Jobs grid displays a list of specifications that have been submitted and the status of the specification.<br />
1. From the <strong>National</strong> <strong>TV</strong> <strong>Toolbox</strong> home page, click to select a report type from the navigation pane on<br />
the left. The grid refreshes to display a list of specifications of that type.<br />
2. Verify that the Jobs grid is displayed. If not, click the Jobs tab to refresh the grid.<br />
3. Look in the Status column to view the status of your report request.<br />
Status Descriptions<br />
Status<br />
Cancelled<br />
Complete<br />
Error<br />
Exceeds Processing Time<br />
In Progress<br />
Locked<br />
Max Rows Exceeded<br />
No Data Returned<br />
Pending<br />
Resubmission<br />
Resubmit in Progress<br />
Resubmit Complete<br />
Submitted<br />
Description<br />
For some reason, your report had to be cancelled by the NPOWER<br />
support team. If it was not resubmitted, contact your NPOWER<br />
representative for more information.<br />
Your report is complete and can be downloaded by clicking on either the<br />
Excel ® or Zip icons.<br />
You may have selected a measurement period that is not yet available or<br />
made illogical selections. Please review your specs, make changes as<br />
necessary, and then resubmit your request. If you receive an error<br />
message again, contact your NPOWER representative.<br />
Your report exceeds the allotted processing time. Please cut back your<br />
selections for statistics, telecasts, market breaks and/or custom coverage<br />
areas, and then resubmit your request.<br />
The report is currently processing.<br />
Reach & Frequency schedules are currently being used for a report<br />
request that is in progress.<br />
Exceeded the row limitation allowed in reports. Please cut back your<br />
report specification, and then resubmit your request.<br />
The report specification resulted in no data.<br />
A scheduled report is awaiting data availability.<br />
The job has been resubmitted by a member of the NPOWER support<br />
team.<br />
The resubmitted job is currently processing.<br />
The resubmitted job is now complete.<br />
Your request was successfully submitted for processing<br />
Note Refresh the page to display the most current report status.<br />
Working with Reports • 11-186<br />
<strong>National</strong> <strong>TV</strong> <strong>Toolbox</strong> <strong>User</strong> <strong>Guide</strong>
Viewing a Report<br />
You can view a report from the <strong>National</strong> <strong>TV</strong> <strong>Toolbox</strong> home page.<br />
1. From the <strong>National</strong> <strong>TV</strong> <strong>Toolbox</strong> home page, click to select a report type from the navigation pane on<br />
the left.<br />
2. Verify that the Jobs grid is displayed. If not, click the Jobs tab to refresh the grid.<br />
3. From the Report Output column, do one of the following:<br />
• Click the Excel Output icon to view the report in Microsoft Excel.<br />
• Click the Zip Output icon to download the zip file.<br />
Note Click the column headers of the grid to sort the columns. Click once to sort in ascending order. Click<br />
again to sort in descending order.<br />
<strong>National</strong> <strong>TV</strong> <strong>Toolbox</strong> <strong>User</strong> <strong>Guide</strong> Working with Reports • 11-187
Modifying Recurring Reports<br />
When you create a report specification and submit it, the default is to run the report one time only (OTO);<br />
however, you can schedule a report to run daily, weekly, monthly, or quarterly as the data becomes available.<br />
These options are based on report type and are located on the Measurement Interval page.<br />
Tip From the <strong>National</strong> <strong>TV</strong> <strong>Toolbox</strong> home page Job Specifications tab, click the Zip Output icon in the<br />
Recurring Reports column to download all completed reports in a recurring report series.<br />
1. From the <strong>National</strong> <strong>TV</strong> <strong>Toolbox</strong> home page, select a report type.<br />
2. From the specification grid, double-click the report specification you wish to modify.<br />
3. Click the Measurement Interval selection tab.<br />
4. Highlight the measurement interval in the Current Selection list.<br />
5. Click Delete.<br />
6. Select the desired measurement interval.<br />
7. Change the Schedule Report option to the desired interval and data type.<br />
8. Click Add.<br />
9. After completing changes, do one of the following:<br />
• Click Save to save the specification without submitting.<br />
• Click Submit to submit the report request.<br />
Tips<br />
• When you submit a report request, the specification is automatically saved.<br />
• When you delete a pending recurring report, the report is no longer recurring.<br />
Working with Reports • 11-188<br />
<strong>National</strong> <strong>TV</strong> <strong>Toolbox</strong> <strong>User</strong> <strong>Guide</strong>
Chapter 12<br />
Cross Platform Reporting - <strong>TV</strong>/Internet<br />
Cross-platform reporting is a service that provides cross-media measurement of both <strong>TV</strong> and the Internet in<br />
one household.<br />
■<br />
■<br />
■<br />
About <strong>Nielsen</strong> Cross-Platform Service - Single Source<br />
About <strong>Nielsen</strong> Cross-Platform Service - Data Fusion<br />
Cross-Platform - Data Fusion Frequently Asked Questions<br />
<strong>National</strong> <strong>TV</strong> <strong>Toolbox</strong> <strong>User</strong> <strong>Guide</strong> Cross Platform Reporting - <strong>TV</strong>/Internet • 12-189
About <strong>Nielsen</strong> Cross-Platform Service - Single Source<br />
<strong>Nielsen</strong> Cross-Platform Service - Single Source provides cross-media measurement and innovative data from<br />
the only dataset to measure <strong>TV</strong> and Internet in same household. These Cross-Platform Homes are<br />
comprised of <strong>TV</strong> and Internet measured households in the <strong>National</strong> People Meter Panel.<br />
The dataset provides unique insights into consumer behavior that can only come from measurement of<br />
television and Internet in the same homes. Clients who subscribe to this service are able to gain a deep<br />
understanding of the following:<br />
• Time spent by consumers on television and Internet on a daily basis<br />
• Simultaneous usage of television and Internet<br />
• The relationship between viewing content on television, streaming content, and surfing the Internet<br />
• Cause and effect - how usage of one media drives usage of the other<br />
• Top programs among visitors to Website X<br />
• Unduplicated reach across media types<br />
• Cross-NTiles - <strong>TV</strong> and Internet usage segments for users of a network and Website<br />
<strong>Nielsen</strong> has rolled out Internet measurement to <strong>National</strong> People Meter homes, thus enabling single source<br />
measurement of <strong>TV</strong> and Internet in the <strong>National</strong> People Meter panel. Panelists have their television viewing<br />
measured by <strong>Nielsen</strong>'s People Meters and their Internet usage on their personal computer (streaming video<br />
and Website navigation) measured by <strong>Nielsen</strong> Online's Internet measurement technology.<br />
During the installation period (December 2009 - October 2010), the "Cross-Platform Homes" (CPH) selection<br />
was comprised of households from the independent Convergence Panel and from the <strong>TV</strong> and Internet<br />
measured households from the <strong>National</strong> People Meter panel. As of November 1, 2010, the Convergence<br />
Panel no longer contributes to the Cross-Platform Homes selection. Access to the independent Convergence<br />
Panel households will remain for historical data only (May 2008 - November 2009).<br />
Subscribing clients also have access to custom analyses tailored to their specific networks, programs, and<br />
Websites.<br />
Please contact your <strong>Nielsen</strong> Client Service Representative if you have any questions or if you would like<br />
more information about the <strong>Nielsen</strong> Cross-Platform Service - Single Source.<br />
Note For Cross-Platform Homes, <strong>TV</strong> data is loaded weekly when the Live+7 viewing is finalized. There will<br />
not be a daily delivery of viewing estimates for Cross-Platform Homes at this time. Internet data is loaded<br />
monthly. Please see the Data Delivery Schedule or the Data Availability on the Measurement Interval for<br />
more information.<br />
Cross Platform Reporting - <strong>TV</strong>/Internet • 12-190<br />
<strong>National</strong> <strong>TV</strong> <strong>Toolbox</strong> <strong>User</strong> <strong>Guide</strong>
About <strong>Nielsen</strong> Cross-Platform Service - Data Fusion<br />
<strong>Nielsen</strong> Cross-Platform Service - Data Fusion is a subscriber-based database that provides the ability to<br />
report both <strong>TV</strong> viewing and Internet usage in one report to gain valuable insight into the relationship between<br />
television and the Internet.<br />
<strong>Nielsen</strong> Cross-Platform Service - Data Fusion is created using a statistical matching process that links<br />
television audience information and Internet usage at the respondent level.<br />
This new form of cross-platform measurement enables users to conduct innumerable custom analyses,<br />
including segmentations by Internet activity and media usage, to make more strategic use of the interaction<br />
between <strong>TV</strong> viewing and Internet usage and to plan more effective campaigns.<br />
Augment television viewing analyses by answering questions such as the following:<br />
• What are the top 10 programs viewed by Men 18-49 who also visit Website X?<br />
• Are viewers to a network both heavy <strong>TV</strong> and Internet users?<br />
• How many hours are spent on each medium?<br />
• What is the unduplicated reach for viewers of a network, visitors of a Website and people who do<br />
both?<br />
Note For more information, please contact your <strong>Nielsen</strong> Client Service Representative.<br />
<strong>National</strong> <strong>TV</strong> <strong>Toolbox</strong> <strong>User</strong> <strong>Guide</strong> Cross Platform Reporting - <strong>TV</strong>/Internet • 12-191
Cross-Platform - Data Fusion Frequently Asked Questions<br />
Cross-Platform - Data Fusion frequently asked questions and answers are provided for reference purposes.<br />
Q1. What is the Cross-Platform - Data Fusion?<br />
A1. The Cross-Platform - Data Fusion is the combination of the <strong>National</strong> People Meter (NPM) and<br />
<strong>Nielsen</strong> Online's RDD//Online panel into a single source database. The data fusion allows you to<br />
understand consumers' use of <strong>TV</strong> and the Internet.<br />
Q2. What is the base of the Cross-Platform - Data Fusion?<br />
A2. NPM households have an Internet access indicator and the <strong>Nielsen</strong> Online RDD//Online panel<br />
Internet usage data are fused to the NPM respondents with online access. The resulting respondent<br />
level fusion file contains all NPM respondents with fused Internet activity for those respondents with<br />
online access.<br />
Analysis of online activity can be performed against either the total population or the online<br />
population.<br />
Q3. What are the sample sizes from the NPM and the <strong>Nielsen</strong> Online RDD//Online panel?<br />
A3. From the NPM:<br />
• 50,000 (approximately) persons aged 2+ reporting daily<br />
• 37,000 (approximately) persons with online access at home<br />
From the <strong>Nielsen</strong> Online RDD//Online panel:<br />
• 250,000 (approximately) persons aged 2+ metered home Internet use<br />
• 10,000 (approximately) persons metered Internet use at work<br />
Q4. Is there an analysis sample size threshold specific to the fused panel, or does it follow the<br />
same minimums as <strong>TV</strong> viewing in the NPM?<br />
A4. The same minimums are appropriate.<br />
Q5. How often are the data updated?<br />
A5. Data are updated monthly. From January 2007 - December 2007, NTI months were used. From<br />
January 2008 forward, calendar months are used.<br />
Q6. What are the data deliverables?<br />
A6. There are three deliverables produced monthly:<br />
<strong>Nielsen</strong> NPOWER - In NPOWER ® , Cross-Platform - Data Fusion can be accessed through two<br />
different delivery methods. One set of files can be accessed from the Custom Characteristics tab on<br />
the Demographics page. These files include <strong>Nielsen</strong> Online Internet market breaks for parent,<br />
brand, and channel. Market breaks are defined as Heavy/Medium/Light/No Usage or Yes/No<br />
Usage.<br />
Example<br />
Cross Platform Reporting - <strong>TV</strong>/Internet • 12-192<br />
<strong>National</strong> <strong>TV</strong> <strong>Toolbox</strong> <strong>User</strong> <strong>Guide</strong>
Beginning with January 2008 data, Cross-Platform - Data Fusion can also be accessed via Cross-<br />
Platform Reporting through the Internet Segmentation and R&F Internet Schedule reports. The <strong>TV</strong>/<br />
Internet Data Fusion is located in the Websites screen. Using the data fusion in these reports allows<br />
for more detailed analysis of the Internet including activity for a specific day, select dayparts, and<br />
time spent.<br />
Websites Page Example<br />
PxP - This is a respondent level file giving the NPM person ID and detailed Internet usage (URL,<br />
date, time, duration). This file is designed to be used by software solutions providers in <strong>TV</strong> analysis<br />
systems.<br />
Excel Tables - This includes nine tables with Internet usage and network information by<br />
demographic.<br />
Q7. What determines whether a Website is included in the Custom Characteristics delivery<br />
method in NPOWER and at what level (High/Medium/Low/No Usage or Yes/No Usage)?<br />
A7. The three-way split applies if 3.0% or more of those with online access have visited the site.<br />
Websites visited by between 0.5% and 3.0% are included in NPOWER with a Yes/No classification.<br />
Websites visited by less than 0.5% of the population with online access are not included in<br />
NPOWER.<br />
Visiting is based on a duration of 1+ seconds.<br />
Note No such restrictions are applied to the Cross-Platform Reporting delivery method.<br />
Q8. When using PxP data, is there an agreed definition of Website visitors that can be used as an<br />
industry standard?<br />
A8. <strong>Nielsen</strong> Online defines usage using 1+ seconds as a criterion. NPOWER uses the same<br />
convention. This being said, please note that there is no industry standard and users are free to<br />
define usage as they please.<br />
Q9. Is the fusion PxP tape designed for use with the mid-minute or all-minute viewing files?<br />
A9. It is compatible with both.<br />
Q10. Which <strong>TV</strong> panel(s) is(are) the Internet data intended to be used with, for example, the NPM?<br />
A10. The data are designed to be used with the NPM and can also be used for Local People Meter<br />
(LPM) analyses that involve national Websites. As with any local cutback, the sample sizes mean<br />
that these LPM analyses should be treated with a degree of caution.<br />
Q11. Can it be used with daily panels, weekly unified, monthly unified or quarterly unified panels?<br />
A11. The household/person numbers are NPM IDs. All persons intab for at least one day in the month<br />
are classified. The data can be used with any number of days or any form of unified panel (daily,<br />
weekly, and so forth).<br />
<strong>National</strong> <strong>TV</strong> <strong>Toolbox</strong> <strong>User</strong> <strong>Guide</strong> Cross Platform Reporting - <strong>TV</strong>/Internet • 12-193
Q12. This is <strong>National</strong> only, correct?<br />
A12. The data are fused at the <strong>National</strong> level and can be cut back to Local markets, although caution<br />
needs to be advised where small samples are concerned.<br />
Q13. Are page views going away? If so, what does that mean for the fusion data we are receiving?<br />
A13. The changing nature of the Internet means that page views are becoming less relevant as a metric<br />
and duration is increasingly being used. This does not mean that page views are going away.<br />
The PxP fusion file has URL and duration so both time spent and page views can be derived.<br />
Q14. Can the fusion data only be used at the monthly level?<br />
A14. The PxP data are fully disaggregated allowing analysis by day and time; therefore, any combination<br />
of days can be analyzed.<br />
The Custom Characteristics NPOWER feeds and the Excel tables are currently monthly.<br />
Q15. Is streaming video part of the data?<br />
A15. Currently video streaming is not part of the data available in NPOWER, but it is included in the<br />
Cross Platform - Data Fusion available through IMS Clear Decisions.<br />
Q16. What is the difference between Cross-Platform - Data Fusion and the Cross-Platform - Single<br />
Source?<br />
A16.<br />
Q17. When will you have the ability to do custom roll-ups with <strong>Nielsen</strong> Online?<br />
A17. Any custom roll-ups that are run through <strong>Nielsen</strong> Online can be made available in the Cross-<br />
Platform - Data Fusion Custom Characteristics deliverable. For more information, please contact<br />
your <strong>Nielsen</strong> Client Service Representative.<br />
Q18. What causes differences between RDD//Online and Cross-Platform - Data Fusion results?<br />
A18. There are a number of reasons why there are differences in results between <strong>Nielsen</strong> Online 's<br />
analysis system and Cross-Platform - Data Fusion:<br />
1. Sample Composition<br />
There are some differences in sample composition between the <strong>Nielsen</strong> Online RDD and the <strong>National</strong><br />
People Meter Sample (NPM). As an example: the fusion data for March 2007 shows 64% of online<br />
men 25-54 to be active Internet users in the month, against a <strong>Nielsen</strong> Online estimate of 60%. The<br />
difference was explained by the household size profile - 37% of men 25-34 on NPM are household<br />
size 1-2 against 25% on the RDD panel, and Internet usage levels are higher in this group than for<br />
men 25-34 in other households.<br />
Cross Platform Reporting - <strong>TV</strong>/Internet • 12-194<br />
<strong>National</strong> <strong>TV</strong> <strong>Toolbox</strong> <strong>User</strong> <strong>Guide</strong>
2. Home/Work duplication<br />
For RDD//Online reporting, the duplication between home and work use is modeled using the combo<br />
panel of around 1,000 persons. The fused results are obtained by separate home and work data<br />
fusions. Both are modeling approaches. <strong>Nielsen</strong> is investigating the possibility of using a common<br />
fusion approach for home and work panels in both RDD//Online and Cross-Platform - Data Fusion,<br />
which will reduce the differences obtained.<br />
Note Differences here are evident more in unduplicated reach than in impressions or page views.<br />
3. Sampling Error and Fusion Respondent Selection<br />
When assessing differences in duplicated impressions, time spent, or page views, certain Websites<br />
can be very volatile as a small number of individuals can be responsible for a very high percentage of<br />
Website usage. Gaming Websites can be particularly susceptible to this. For example, if there are two<br />
individuals in the RDD panel responsible for 80% of the page views of a Website and the fusion only<br />
selects one of these individuals as a good match for NPM respondents, the page views could reduce<br />
by 40%. Essentially, this is a manifestation of sampling error, and it can be further exacerbated by<br />
sample weighting.<br />
4. Fusion Bias<br />
All research contains error and all fusion contains the possibility of model bias. The Cross-Platform -<br />
Data Fusion data to August 2007 shows some evidence of bias in the combined reach of multiple<br />
Websites, with the fusion data slightly over-estimating the reach (but not page views or time spent). A<br />
change in methodology for September 2007 addresses this.<br />
5. Data Feed Differences<br />
An issue that affected data up to December 2007 is related to the timing of the implementation of<br />
brand and channel definitions. This is discussed below:<br />
The Issue<br />
There were differences in definition between some brands and channels reported in <strong>Nielsen</strong> Online's<br />
reporting system and brands and channels reported in NPOWER using Cross-Platform - Data Fusion.<br />
Why did this happen?<br />
Although both the <strong>Nielsen</strong> Online reporting system and the data fusion used data from the <strong>Nielsen</strong><br />
Online RDD panel, they used different data feeds. There were two main differences:<br />
I) The <strong>Nielsen</strong> Online system reported data monthly, based on calendar month. The data fusion took<br />
weekly data feeds that were grouped into broadcast months.<br />
ii) <strong>Nielsen</strong> Online has a brand and channel dictionary that groups Website URLs into reporting entities,<br />
for example, AOL is a brand, and AOL Sports is a channel. This dictionary is finalized towards the end<br />
of the month and applied to the calendar month data retrospectively, before the data are included in<br />
<strong>Nielsen</strong> Online's reporting system. For the data fusion feed, the finalized dictionary was applied to the<br />
latest weekly feed as it became available - typically week four of the broadcast month. For most<br />
brands and channels, the dictionary was unchanged from month to month, but if a brand or channel<br />
change did occur, <strong>Nielsen</strong> Online and Cross-Platform - Data Fusion were inconsistent for the affected<br />
brand or channel for up to three weeks of the month.<br />
What did we do to address this issue?<br />
<strong>National</strong> <strong>TV</strong> <strong>Toolbox</strong> <strong>User</strong> <strong>Guide</strong> Cross Platform Reporting - <strong>TV</strong>/Internet • 12-195
To obtain complete consistency between <strong>Nielsen</strong> Online and the data fusion for monthly brand and<br />
channel definitions, it would be necessary to change the <strong>Nielsen</strong> Online reporting system to broadcast<br />
month reporting or change broadcast month reporting to calendar month. Neither of these was a<br />
feasible option; however, an improvement in consistency was obtained by using the same calendar<br />
month feed for both <strong>Nielsen</strong> Online reporting and the data fusion. This reduced the inconsistency<br />
between the two data sets to 0-6 days in any month, rather than the previous 15-21 days.<br />
When did this change come into effect?<br />
The change occurred for data from January 2008.<br />
Q19. Why does data fusion only include panel members who are permanent residents and not<br />
long-term or short-term visitors?<br />
A19. Our data fusion process only classifies in-home panel members. Long-term and short-term visitors<br />
are not classified. There are two main reasons for this:<br />
1. There is insufficient information about visitors to make data fusion feasible. For short term visitors we<br />
have just age and gender and only a few additional categories for long-term visitors. Long term visitors<br />
may have very different characteristics from the homes they are visiting, for example, grandparents<br />
may have very different characteristics and viewing from the homes that they visit.<br />
2. In-home panel members are a representative sample of the population. In our People Meter sample,<br />
we don't measure the out of home viewing of our in-home panel members, but measure visitor viewing<br />
in their homes as a surrogate. So visitors as consumers are already represented in the in-home<br />
sample, which is representative of the population.<br />
Calculating target rating indexes using data fusion<br />
A common analysis requirement is to compare a Website users' viewing against a base target, for<br />
example, Men 18-49 users of Website X against All Men 18-49. In NPOWER, the All Men 18-49 rating<br />
will include visitors, while the Website X users' rating will not. Visitor viewing typically averages around<br />
5% of total viewing so an index of 95 among Website X users is actually likely to be an index of 100 if<br />
we compare like-for-like viewing, that is, excluding visitors.<br />
The All Men 18-49 rating excluding visitors can be obtained by using Permanent Residents as the<br />
composite with the Custom Characteristics delivery method. The Permanent Residents classification<br />
includes all NPM respondents who are permanent residents in their household (no visitors) who are<br />
intab during the specific period.<br />
If using the Cross-Platform Reporting delivery method for ratings analysis, the All Men 18-49 rating<br />
excluding visitors can be calculated by running classifications that in combination define the total<br />
population. For example, Men 18-49 users of Website X combined with Men 18-49 non-users of<br />
Website X. This provides a consistent benchmark for assessing Website X viewing relative to the total<br />
population base.<br />
Using a factoring approach to estimate visitor viewing by fused category<br />
We recommend the following approach should be applied to incorporate visitor ratings:<br />
Cross Platform Reporting - <strong>TV</strong>/Internet • 12-196<br />
<strong>National</strong> <strong>TV</strong> <strong>Toolbox</strong> <strong>User</strong> <strong>Guide</strong>
Reach and Frequency<br />
There are various approaches that can be taken to address the incremental reach and frequency due<br />
to visitor viewing. Any treatment of visitors in reach and frequency calculation should ideally also<br />
address non-response due to sample turnover and non-reporting days: probability modeling using the<br />
negative binomial distribution is a good way of delivering credible and consistent results.<br />
Note Effective 1/31/2011, all frequency metrics include duplicate viewing.<br />
Q20. Can I combine months when analyzing Cross-Platform - Data Fusion?<br />
A20. It is not recommended to combine or cross months when analyzing Cross-Platform - Data Fusion.<br />
Because all NPM panelists are re-fused each month, crossing or combining months can lead to<br />
inflated reach figures as monthly correlations are not all captured. However, ratings and duration<br />
figures are not affected.<br />
Q21. Can you explain why Heavy <strong>TV</strong> viewers are also Heavy Internet users?<br />
A21. Top-line results from <strong>Nielsen</strong>'s Cross-Platform - Data Fusion and Cross-Platform - Single Source<br />
show that, within homes with internet access, heavy <strong>TV</strong> viewers tend to be heavier internet users<br />
than light <strong>TV</strong> viewers.<br />
In actual fact, both these data sources show that Heavy <strong>TV</strong> viewers tend to be heavier internet<br />
users at home. This is logical because heavy viewing is related to availability to view and this<br />
implies availability to surf at home as well. In addition, the convergence panel shows that nearly a<br />
third of web usage coincides with <strong>TV</strong> viewing so it does not seem that <strong>TV</strong> viewing reduces the time<br />
for surfing or vice versa.<br />
The data fusion also shows that heavy <strong>TV</strong> viewers tend to be lighter users of the Internet at work, a<br />
logical finding. However, this is outweighed by the skew in home Web use meaning that even when<br />
considering home and work use together, heavy <strong>TV</strong> viewers tend to be heavy Internet users. The<br />
chart below illustrates this for Persons 18+, drawing on Cross-Platform - Data Fusion data from<br />
August 2008.<br />
<strong>National</strong> <strong>TV</strong> <strong>Toolbox</strong> <strong>User</strong> <strong>Guide</strong> Cross Platform Reporting - <strong>TV</strong>/Internet • 12-197
Note that these finding apply to people with Internet access: the heaviest viewers in the total<br />
population tend to be older and/or lower income, and these groups have lower Internet penetration<br />
and therefore, lower overall Internet use.<br />
Cross Platform Reporting - <strong>TV</strong>/Internet • 12-198<br />
<strong>National</strong> <strong>TV</strong> <strong>Toolbox</strong> <strong>User</strong> <strong>Guide</strong>
Chapter 13<br />
Reference<br />
The reference section contains auxiliary reference material.<br />
■<br />
■<br />
■<br />
■<br />
■<br />
Daily Intab Counts<br />
Daily Scaled Installed Counts<br />
Daily Scaled Intab Counts<br />
Proportionate Equivalent Sample Size<br />
Viewing the <strong>National</strong> Reference Supplement<br />
<strong>National</strong> <strong>TV</strong> <strong>Toolbox</strong> <strong>User</strong> <strong>Guide</strong> Reference • 13-199
Daily Intab Counts<br />
These counts represent the number of households and persons in our NPM sample on a given day that are<br />
providing usable viewing data.<br />
Viewing data from these homes are used in tabulation of our audience estimates.<br />
Appropriate Uses Prior to September 2003<br />
In a proportionately selected sample, the Intab Counts represent the sample (and sample size) used in<br />
various audience estimate calculations. If one has some of the pieces of data used to calculate an audience<br />
estimate, they can often derive the remaining data.<br />
Appropriate Uses September 2003 to Present<br />
Effective September 2003, the NPM sample viewing data and Intab homes and persons are weighted to<br />
reflect proper national representation of several household characteristics, including geography. Nonweighted<br />
Intab counts can no longer be used to derive or calculate audience estimates or other components<br />
of audience estimates.<br />
Note Effective September 2003, the "sum of weighted viewing minutes" has replaced "minutes viewed" and<br />
"weighted intabs" has replaced "intabs" or "base" in all NPM audience estimate calculations.<br />
Reference • 13-200<br />
<strong>National</strong> <strong>TV</strong> <strong>Toolbox</strong> <strong>User</strong> <strong>Guide</strong>
Daily Scaled Installed Counts<br />
Installed Counts represent the number of metered households and people in those households in our NPM<br />
sample on a given day.<br />
Scaled Installed Counts are installed counts that have been geographically weighted to account for the over<br />
sampling of LPM markets.<br />
Appropriate Uses<br />
Scaled Installed Counts are available as of February 2004. Scaled installed counts can be used to assess<br />
and project sample composition percentages, which in-turn should reflect the country or sub samples of the<br />
country as accurately as a sample of this size can, without further weighting.<br />
Daily Scaled Installed Counts also appear in the Sample Statistic Generator (SSG) tool accessible via the<br />
<strong>Nielsen</strong> Answers ® portal.<br />
Notes<br />
• All <strong>Nielsen</strong> NPOWER installed counts are labeled Daily Scaled Installed Counts; however, this column<br />
includes true Installed Counts for data prior to February 2004.<br />
• Scaling does not apply to the Convergence Research Panel. It will apply to the NPM portion of Cross-<br />
Platform Homes when sample size dictates, which is anticipated to be 2nd quarter 2010.<br />
<strong>National</strong> <strong>TV</strong> <strong>Toolbox</strong> <strong>User</strong> <strong>Guide</strong> Reference • 13-201
Daily Scaled Intab Counts<br />
These counts are geographically balanced Intab Counts that appropriately adjust for the over sampling of<br />
LPM markets.<br />
Intab Counts represent the number of metered households and people in those households who supply<br />
useable information for reports.<br />
Intab households and persons are those that are used in daily tabulations and constitute the daily sample<br />
size. Data from these households have passed edits based on The <strong>Nielsen</strong> Company's established criteria<br />
for completeness and accuracy. These households or persons provide good <strong>TV</strong> viewing records.<br />
Appropriate Uses<br />
Scaled Intab Counts are available as of February 2004. Scaled Intab Counts can be used to assess the<br />
geographically proportionate number of sample households or persons able to contribute to viewing<br />
audiences.<br />
Daily Scaled Intab Counts also appear in the Sample Statistic Generator (SSG) tool accessible via the<br />
<strong>Nielsen</strong> Answers ® portal.<br />
Notes<br />
• All <strong>Nielsen</strong> NPOWER Intab Counts are labeled Daily Scaled Intab Counts; however, this column<br />
includes gross or total Intab Counts for data prior to February 2004.<br />
• Scaling does not apply to the Convergence Research Panel. It will apply to the NPM portion of Cross-<br />
Platform Homes when sample size dictates, which is anticipated to be 2nd quarter 2010.<br />
Reference • 13-202<br />
<strong>National</strong> <strong>TV</strong> <strong>Toolbox</strong> <strong>User</strong> <strong>Guide</strong>
Proportionate Equivalent Sample Size<br />
Proportionate Equivalent Sample Size (PESS) is the measure of effective change in intab sample size due to<br />
weighting. PESS is only used in the computation of standard errors, and cannot be used in computing sample<br />
composition percentages or audience estimates.<br />
Proportionate equivalent sample size (PESS) is computed at the building block level on a daily basis. The<br />
effective sample size for each category is calculated as:<br />
Proportionate equivalent sample size =<br />
• Sum the contributing weights and then square the sum.<br />
• Square each contributing weight and then sum the squares.<br />
• Divide the first sum by the second to achieve a daily proportionate equivalent sample size for the<br />
building block category.<br />
When reporting across multiple days, the daily proportionate equivalent sample sizes are averaged in the<br />
same manner as average daily intabs are computed today.<br />
Average Proportionate Equivalent Sample Size =<br />
<strong>National</strong> <strong>TV</strong> <strong>Toolbox</strong> <strong>User</strong> <strong>Guide</strong> Reference • 13-203
Viewing the <strong>National</strong> Reference Supplement<br />
The <strong>National</strong> Reference Supplement provides specific policy information about samples, sample weighting,<br />
audience estimates, program/station information, time period and audience estimates, computational<br />
procedures, and so forth. A new reference supplement is released in the last quarter of each year.<br />
1. From http://www.nielsen.com, in the Client log in area, type your Client ID and Password.<br />
2. Click the Delivery tab.<br />
3. From the <strong>National</strong> Products list in the left pane, click <strong>National</strong> Report Library.<br />
4. From the <strong>National</strong> Report Library page, click the arrow to the left of the All Reports to expand the<br />
list.<br />
5. Click the arrow to the left of <strong>National</strong> Reference Data (RDN) to expand the list.<br />
6. Scroll down the list and then click <strong>National</strong> Reference Supplement.<br />
7. From the list of reports displayed, click to select <strong>National</strong> Reference Supplement .<br />
8. From the File Download dialog box, do one of the following:<br />
• Click Open to open the file.<br />
• Click Save to save the file to your computer.<br />
Note This is the recommended option for the file to work properly. After you save the file to<br />
your computer, you can open it.<br />
• Click Cancel to cancel the request.<br />
Reference • 13-204<br />
<strong>National</strong> <strong>TV</strong> <strong>Toolbox</strong> <strong>User</strong> <strong>Guide</strong>
Glossary<br />
AD<br />
Alternate Delivery Source<br />
Alternate delivery sources are C-Band satellite dish, direct broadcast satellite <strong>TV</strong> systems, wireless cable,<br />
and so forth.<br />
Advertiser<br />
A company that operates and controls other separately chartered businesses through equity ownership.<br />
All Sites<br />
When combined with the Total Internet Usage selection on the Internet Source page, All Sites is similar in<br />
concept to Persons Using Television; it includes all browser-based surfing and browser-based applications,<br />
as well as video streaming use. All Sites always includes Adult sites, as well as Unclassified sites, and can be<br />
selected on the Websites page.<br />
All Streaming<br />
All Streaming must be combined with the Video Streaming Only selection on the Internet Source page to get<br />
overall streaming users/usage. All Streaming always includes Adult sites, as well as Unclassified sites, and<br />
can be selected on the Websites page. Streaming sites, as well as Unclassified sites, and can be selected on<br />
the Websites page. Streaming data follows different collection and business rules than navigation/surfing<br />
data.<br />
AOT<br />
All Other Tuning<br />
Content that cannot be identified by codes or matching audio signatures; therefore, cannot be assigned to a<br />
final distributor (and thus a station code). In order for content to be considered , the unencoded/unmatched<br />
content must originate from a HUT device such as a <strong>TV</strong> or set-top box.<br />
Unencoded content from a video game or DVD player does not contribute to AOT. Viewing from those<br />
devices is contributed to the respective viewing buckets.<br />
Viewing from an Internet to <strong>TV</strong> device, such as ROKU or APPLE <strong>TV</strong>, does not credit to any reportable<br />
bucket, regardless of content. However, due to changes we are making to our crediting system, in late 2012,<br />
any encoded content viewed on those devices will credit to the network/program.<br />
Average Minutes Viewed<br />
AA% x Duration ÷ 100 in minutes.<br />
BC<br />
Base Counts<br />
Also known as Intab Sample Counts.<br />
Boolean Logic<br />
A form of algebra used in computer operations to process information and solve problems.<br />
Brand (Monitor-Plus)<br />
A class of goods or services identified by name as the product of a single firm or manufacturer. A MONITOR-<br />
PLUS brand may be a composite of manufacturer name and the product/service being advertised.<br />
Brand (Internet)<br />
A brand may be a branded subsidiary or a brand of a property that has a consistent collection of branded<br />
content of the Internet. The brand's individual identity must be conveyed consistently or prominently<br />
throughout the brand as well as all channels and domains, which are in its consolidation. A brand may consist<br />
of channels, domains, and URLs.<br />
Brand Variant<br />
A further refinement or description of a brand.<br />
<strong>National</strong> <strong>TV</strong> <strong>Toolbox</strong> <strong>User</strong> <strong>Guide</strong> Glossary • 1-205
Breakout<br />
An indicator assigned to a telecast that specifies that it should be excluded from monthly program names<br />
processing so it will not skew ratings for the program. For example, a program not aired at its normal day or<br />
time may be identified as a breakout since its ratings may be lower.<br />
Broadcast Day<br />
The time frame for which networks set up programming. The broadcast day varies by network.<br />
Broadcast Network<br />
Stations affiliated with a broadcaster that produces and distributes its own programming.<br />
C3<br />
is an ACM ratings estimate based on the average of all commercial minutes in a given program, including<br />
three days of DVR playback. Commercial minutes are identified using a combination of Monitor-Plus pattern<br />
recognition technology, program provider logs and content video.<br />
Cable Network<br />
A supplier of television programs distributed by satellite to cable systems. A specific type of distributor that<br />
airs media events by satellite and that may also supply media events to other distributors.<br />
Category/Sub-category<br />
A grouping of similar Web content. A brand or channel can only fall under one category to prevent double<br />
counting.<br />
Channel<br />
A channel is the lowest level of the hierarchical structure for Web properties. Channels can be loosely defined<br />
as destinations on the Web where editorial consistency is focused on specific viewer interest such as<br />
auctions or weather. The channels will be named according to user experience and content type.<br />
Composite<br />
The total number of television households within a coverage area. When reporting market breaks, the<br />
individual market breaks within a section that are mutually exclusive can sum to total composite. For<br />
example, within the market section of County Size, the market breaks of County Size A, County Size B,<br />
County Size C, and County Size D would sum to total composite.<br />
Concurrent<br />
See Simultaneous.<br />
Coverage Area<br />
A specific group of homes that is capable of receiving a particular data source and service. In addition, with<br />
<strong>Nielsen</strong> NPOWER, we allow primary or custom coverage areas.<br />
Creative<br />
An advertisement for a specific brand. The MONITOR-PLUS ® Service assigns a descriptive title to each<br />
national commercial. The creative title lets you differentiate between multiple advertisements for the same<br />
brand.<br />
Cross Platform Homes<br />
Effective November 2009 going forward, a subsample of the <strong>National</strong> People Meter homes with dual<br />
measurement for <strong>TV</strong> and Internet Meters.<br />
CVG AA%<br />
Coverage Area AA%<br />
An average of the viewing audience for each minute of a program or daypart expressed as a percentage or<br />
as an estimated number of households or persons within a certain coverage area. This statistic is based on<br />
the originator's primary coverage area.<br />
Total US AA% x Total US UE ÷ Coverage Area UE<br />
Note Effective 1/31/11, includes duplicate viewing for DVR playback. Effective 4/25/2011, includes any<br />
eligible PC contribution for extended screen.<br />
Glossary • 1-206<br />
<strong>National</strong> <strong>TV</strong> <strong>Toolbox</strong> <strong>User</strong> <strong>Guide</strong>
CVG UE (000)<br />
Coverage Area UE<br />
The statistically derived subset of the total population of households or persons based on a coverage area.<br />
CVG UE Type<br />
In the report output, indicates if the primary coverage area selected is a standard or a custom UE.<br />
Daily Installed Count<br />
The raw number of households installed with meters and persons within those households that could<br />
contribute to the daily tabulations if all The <strong>Nielsen</strong> Company defined edit criteria are met.<br />
Daily Intab Count<br />
The number of households and persons in our NPM sample on a given day that are providing usable viewing<br />
data. Viewing data from these homes are used in tabulation of our audience estimates.<br />
Daily Scaled Installed Count<br />
A geographically scaled count of installed households/persons. Each installed home/person located outside<br />
an integrated LPM market contributes a value of 1 to the scaled install count, while each installed home/<br />
person located in an integrated LPM market contributes a value less than 1. This weight is used to correct for<br />
the over-representation of the integrated LPM markets, and is a function of the relationship between <strong>TV</strong> HH<br />
universes and sample sizes for LPM markets and Remainder U.S. Scaled install counts enable analysis of<br />
sample distribution, including comparison to national universe estimates.<br />
Note Does not apply to <strong>TV</strong>/Internet Convergence Research Panel.<br />
Daily Scaled Intab Count<br />
A geographically scaled count of intab households/persons. The value assigned to each installed household/<br />
person (see Daily Installed Count) is applied to only those households and persons having passed edits<br />
enabling them to contribute to the daily tabulations. Scaled intab counts enable analysis of sample<br />
distribution, including comparison to national universe estimates.<br />
Note Does not apply to <strong>TV</strong>/Internet Convergence Research Panel.<br />
Data Availability<br />
Identifies the dates available for reporting by type of data.<br />
Data Fusion<br />
Data fusion is a method of integrating data. What sets it apart from other approaches is that it is a<br />
respondent-level matching of data sets: respondents from one survey are paired with respondents from<br />
another survey.<br />
Daypart<br />
An interval of time within a day for which you can report audience data. It is defined by days and hours. A<br />
combination of two or more dayparts will have ratings data combined and averaged on the report. Reported<br />
segments of the day that, in general, reflect television station programming patterns. Comparison of audience<br />
estimates between dayparts may indicate differences in size and composition of available audiences.<br />
Demographic<br />
The age, gender, and person classification used to categorize viewers. They are derived from viewer<br />
characteristic data collected in the homes. You can also report data for households. Multiple demographics<br />
can be combined into groups.<br />
Direct Response<br />
Direct response is a form of advertising used to sell goods directly to consumers. Direct response advertising<br />
is different from general consumer advertising in that it calls for an immediate response. Direct response<br />
advertisements usually feature products unavailable in stores and the focus is on selling now rather than<br />
building an image for the advertiser. The advertisements are characterized by emphasizing the ordering<br />
information with statements such as Here's how to order or Order now.<br />
<strong>National</strong> <strong>TV</strong> <strong>Toolbox</strong> <strong>User</strong> <strong>Guide</strong> Glossary • 1-207
Duration<br />
The period of time during which a telecast or daypart airs.<br />
DVD<br />
Digital Video Disc<br />
A family of optical discs that have the same overall dimensions of a CD, but have significantly higher<br />
capacities. DVDs are also double-sided, whereas CDs are single-sided.<br />
DVR<br />
Digital Video Recorder<br />
A device used to record <strong>TV</strong> content for later viewing. It stores the information on a hard drive or in memory<br />
instead of on tapes, like a VCR.<br />
DVR Playback as Time Period Viewing Source<br />
DVR Playback is playback of DVR content credited at the actual time/day of the playback, regardless of how<br />
old the content is or what is being played back. This viewing does not contribute to HUT.<br />
When this viewing is being processed for playback crediting, any DVR Playback that is beyond 7 days (168<br />
hours) is not credited back to the original time period or program; however, DVR Playback within Live+7 (168<br />
hours) is also credited back to the original time period or program.<br />
Note Since DVR Playback is DVR viewing at the actual time/day of the playback, it will never contain<br />
additional playback viewing; it will remain as Live.<br />
Episode<br />
A specific airing of a telecast for which cable originators can request ratings data.<br />
Episode Title<br />
A label that identifies a specific creative associated with the telecast of a program.<br />
Error Message<br />
A message displayed or printed to tell you about an error or problem in the execution of a program or in your<br />
communication with the system.<br />
Expanded Type<br />
Defines the content of cable telecasts in a more detailed manner. For example, a summary program type<br />
might be SE for Sporting Event and an Expanded program type might be SFBL for Softball.<br />
Extended Home<br />
The residence of a NPM primary household member who is living away from home while attending an<br />
institute of higher learning (4-year college, community college, vocational school, culinary school, design or<br />
fashion institute, and so forth).<br />
Extended Screen<br />
The crediting of online viewing of qualified television content to the standard television audience data,<br />
resulting in a combined national television rating.<br />
Filter<br />
Limits the scope and scale of an analysis by qualifying report output. For example, you can limit results by<br />
specifying market break and demo criteria.<br />
Frequency<br />
The average number of times households or persons viewed a given program, station, or advertisement<br />
during a specific time period, such as one month. This number is derived by dividing the Gross Rating Points<br />
(GRP) by the total non-duplicated audience (cume). For example, if a group of programs achieved 30 GRPs<br />
and a cume of 20, then the average frequency would be 1.5 exposures per person or household.<br />
Note Effective 1/31/2011, all frequency metrics will include duplicate viewing.<br />
Glossary • 1-208<br />
<strong>National</strong> <strong>TV</strong> <strong>Toolbox</strong> <strong>User</strong> <strong>Guide</strong>
Frequency Distribution<br />
The number or percentage of individuals or households that were re-exposed to a program, station, or<br />
advertisement one time, two times, three times, and so forth.<br />
Fringe Time<br />
Time periods before and after prime time network programming.<br />
Fusion<br />
The merging of one or more databases.<br />
GAA<br />
Gross Average Audience<br />
The sum of viewing audience averages for all tuning and viewing minutes of a program. Tuning and viewing<br />
to the same minute of a program or its repeat telecast is counted each time. True simultaneous tuning and<br />
viewing (same day and time) is eliminated.<br />
Gain<br />
Gain of audience from prior minute of a minute-by-minute report.<br />
GRP<br />
Gross Rating Points<br />
A unit of measurement of audience size for television. This is used to measure the exposure to one or more<br />
programs or national commercials without regard to multiple exposures of the same advertising to individuals.<br />
One GRP is 1% of <strong>TV</strong> Households.<br />
• Spot GRP is the count of duplicated viewing: gross rating points. Spot GRP % = AA Reach % x AA<br />
Average Minutes Spot GRP PROJ (000) = AA Reach Projection x AA Average Minutes.<br />
• Qualified GRP is unduplicated viewing: gross reach points. Qualified GRP % = AA Reach % x AA<br />
Average Frequency Qualified GRP PROJ (000) = AA Reach Projection x AA Average Frequency<br />
Hispanic Network<br />
A type of media distributor that provides media events to a number of stations or cable headends. The media<br />
events are typically geared toward a Hispanic audience and are provided in the Spanish language.<br />
Household<br />
A family within a sample unit.<br />
HUT<br />
Households Using Television<br />
The percentage of all television households using their television sets and DVR playback at time of playback<br />
during the average minute of a specific time period. This is based on New York time in the eastern time zone,<br />
and in other time zones, on the principal telecast time of the typical network program airing during that time<br />
period.<br />
Include Promo Flag<br />
Determines whether promotional seconds are included when determining if a minute qualifies as a national<br />
commercial minute or as program only.<br />
Indicators<br />
Special attributes attached to programs that let a user choose a set of days on which selected programs air<br />
and also permit dropping of specials, breakouts, or programs of less than five minutes' duration. For<br />
syndication, a user can also drop long-term programs.<br />
Intab Sample<br />
The number of television households providing usable information for reports or special tabulations. Intab<br />
sample here refers to metered rather than diary households.<br />
Intab Sample Counts<br />
Statistics related to the intab sample. Also known as Base Counts.<br />
<strong>National</strong> <strong>TV</strong> <strong>Toolbox</strong> <strong>User</strong> <strong>Guide</strong> Glossary • 1-209
Linear Television<br />
Encoded video content that is credited to a specific linear telecast (content that airs at a specific date and<br />
time) within seven days of airing. By policy, the full <strong>National</strong> Commercial load is included on all platforms on<br />
which the linear content is served. Linear data can credit to C3/Average Commercial Minute ratings.<br />
Typically, linear television is across broadcast, cable, syndication, and unwired distributors.<br />
Live<br />
Households tuning or Persons viewing a program or time period of a specific station or cable network,<br />
including VCR record, at the actual time the show was telecast. Any use of the DVR to time shift content<br />
(regardless of how small the delay) will cause that tuning to be excluded from the Live estimates.<br />
Live+SD<br />
Households tuning or Persons viewing a program or time period of a specific station or cable network,<br />
including VCR record, at the actual time the show was telecast, and any DVR playback tuning/viewing in the<br />
same processing day to a pre-recorded program or time period that is shifted 'back' to original telecast time.<br />
The processing day is the same collection day used for daily processing; however, this will also include some<br />
households that are in different time zones than the market with which they are collected. As a result, data for<br />
some homes may be collected at 2:00 a.m. instead of 3:00 a.m. local time.<br />
Live+7<br />
Households tuning or Persons viewing a program or time period of a specific station or cable network,<br />
including VCR record, at the actual time the show was telecast, and any DVR playback tuning/viewing within<br />
7 days (168 hours) to a pre-recorded program or time period that is shifted 'back' to original telecast time.<br />
Live+X<br />
Subset of Live+7 based on user definition.<br />
Loss<br />
Loss of audience from prior minute of minute by minute report.<br />
LOT<br />
Length of Tune<br />
A report that examines the average length of tuning events of varying lengths and distribution for a time<br />
period or daypart and viewing source.<br />
LOV<br />
Length of View<br />
A report that examines the average length of viewing events of varying lengths and distribution for originator,<br />
program, and program trackage.<br />
LPM<br />
Local People Meter. See People Meter.<br />
MAMI<br />
Median Age and Median Income<br />
A report that identifies the median of an age group, persons-based household income, and income group for<br />
a program, or program originator within a network.<br />
Note Effective 4/1/2007, the midpoint of the income range will be reported. Please refer to Income Ranges<br />
and Mid-points.<br />
Market Break<br />
A group of one or more geographic groups or household characteristics that permit reporting breakdown of<br />
viewers. An example of a market break would be "pay <strong>TV</strong>, no cable," where basic cable is no or basic cable<br />
is unknown and pay <strong>TV</strong> is yes.<br />
Glossary • 1-210<br />
<strong>National</strong> <strong>TV</strong> <strong>Toolbox</strong> <strong>User</strong> <strong>Guide</strong>
MarketView<br />
<strong>Nielsen</strong> Online's Website classification dictionary. MarketView shows the relationship or hierarchy of the<br />
organization within a parent company. There are three levels to MarketView: Parent level, Brand level and<br />
Channel level. Brands and channels are assigned to a category and sub-category.<br />
MC<br />
Most Current<br />
The latest data available, crossing viewing types, if necessary, based on the measurement interval selected.<br />
For example, selecting Most Current data for a measurement interval that is incomplete for Live+7 results in<br />
an average of the Live+7 and Live+SD data that is available to date.<br />
Measurement Interval<br />
A period of time during which viewing data is gathered for reporting purposes.<br />
Minimum<br />
The smallest allowable level reportable based on sample size, or sample size plus viewing (ratings and<br />
projections) data, or for a calculated number. Currently, only average area minimums vary by service, but<br />
flexibility has been planned for all minimums to vary by service. No minimums are applied to NPOWER<br />
reports.<br />
MOP<br />
Minute of Program<br />
A specific program minute based on the program start time relative to the first minute of the program or the<br />
station/outlet airing of the program. The first minute of a program is minute number one. When a program is<br />
joined-in-progress, it is important to indicate the correct minute of program so the ratings are produced<br />
correctly.<br />
A program with a 30-minute duration has 30 MOPs, where the first minute of the program is MOP 1, the last<br />
minute is MOP 30.<br />
Most Current (MC)<br />
The latest data available, crossing viewing types, if necessary, based on the measurement interval selected.<br />
For example, selecting Most Current data for a measurement interval that is incomplete for Live+7 results in<br />
an average of the Live+7 and Live+SD data that is available to date.<br />
Multiprocessing<br />
A term used to refer to the procedure of removing duplicate viewing minutes within the same household for<br />
<strong>TV</strong> usage or program audience calculations. For more information, refer to the <strong>National</strong> Reference<br />
Supplement.<br />
N/A (Not Applicable)<br />
Does not apply for the selection.<br />
<strong>National</strong> Commercial<br />
A national advertisement, announcement, spot, or message aired on television for a minimum duration of 10<br />
seconds and is paid for by an advertiser.<br />
<strong>National</strong> Commercial Length<br />
Reported national commercial lengths are 10, 15, 20, 30, 45, 60, 90, and 120+ seconds, or the specific<br />
number of seconds for irregular-length national commercials. <strong>National</strong> commercial durations are captured as<br />
broadcast, not as purchased, except in the following situations: Identical brands airing back-to-back with<br />
durations under 30 seconds will be combined, their durations summed, and reported as an individual<br />
occurrence with a duration equal to the sum of each individual announcement.<br />
NCCM<br />
<strong>National</strong> Commercial Clock Minutes<br />
Any minute of program where a national commercial or national promotion, or part of a national commercial<br />
or national promotion, appears.<br />
<strong>National</strong> <strong>TV</strong> <strong>Toolbox</strong> <strong>User</strong> <strong>Guide</strong> Glossary • 1-211
NCCM Duration<br />
<strong>National</strong> Commercial Clock Minutes Duration<br />
Sums the number of seconds included in NCCM AA%.<br />
NCCM Index<br />
<strong>National</strong> Commercial Clock Minutes Index<br />
NCCM AA% ÷ Telecast AA% x 100<br />
NCCM Projection<br />
The NCCM projection is the projected audience estimate representing viewing to all <strong>National</strong> Clock<br />
Commercial Minutes.<br />
Nested Boolean Logic<br />
The terminology used to describe a parenthetical Boolean expression within a Boolean expression. Nested<br />
Boolean is used to create more complex expressions to extract data for reports.<br />
Net<br />
Net gain or loss of audience.<br />
Network<br />
A type of media distributor that provides media events to a number of stations or cable headends. This is a<br />
specific type of distributor.<br />
Network Affiliate<br />
A television station that has a contract with one or more networks to carry the network's programs and<br />
announcements, as well as its own.<br />
Network Television<br />
A group of television stations linked by telephone lines, coaxial cable, satellite, or microwave in order to<br />
broadcast programs simultaneously.<br />
NHI<br />
<strong>Nielsen</strong> Homevideo Index<br />
The <strong>Nielsen</strong> Company servicing division that services the cable industry, including pay and ad-supported<br />
networks, as well as local cable systems and cable interconnects (local networks) with data from the national<br />
people meter sample and/or local samples.<br />
NHTI<br />
<strong>Nielsen</strong> Hispanic Television Index<br />
Reports viewing to Spanish language television networks by measuring the viewing habits of Hispanics living<br />
in the United States. Data are collected from a national People Meter sample.<br />
NOM<br />
Number of Minutes<br />
The number of minutes viewed.<br />
Non-Linear Television<br />
Encoded video content that is not credited to a specific linear telecast. Non-linear content is measured at the<br />
program/episode level across the interval of time it is available to consumers. Non-linear content is encoded<br />
separately from the linear telecast encoding and does not contribute to recently telecast VOD or C3.<br />
* Examples of non-linear are: encoded content on video streaming services, encoded content hosted on<br />
demand via cable/satellite services, or encoded content delivered through a video game console or other <strong>TV</strong>connected<br />
device.<br />
NPM<br />
<strong>National</strong> People Meter<br />
See People Meter.<br />
Glossary • 1-212<br />
<strong>National</strong> <strong>TV</strong> <strong>Toolbox</strong> <strong>User</strong> <strong>Guide</strong>
NSS ®<br />
<strong>Nielsen</strong> Syndication Service<br />
The <strong>Nielsen</strong> Company servicing division that services producers, barter syndicators, syndication<br />
representatives, and unwired networks with data from both the national people meter sample and local NSI<br />
samples.<br />
NTI<br />
<strong>Nielsen</strong> Television Index<br />
The <strong>Nielsen</strong> Company servicing division that services broadcast networks, advertisers, and agencies with<br />
data from the national people meter sample. There is one basic NTI ® national published report: The<br />
Pocketpiece ® .<br />
NTile<br />
A custom subsample created by evenly dividing households or persons into groupings based on total minutes<br />
viewed or average minutes viewed per in-tab day. Viewers may be grouped into terciles, quartiles, quintiles,<br />
deciles, or other custom grouping level.<br />
Originator<br />
(1) Any entity responsible for originating programs. (2) The programming source for an analysis: a particular<br />
broadcast network, cable network, or syndicator.<br />
OTO<br />
One Time Only<br />
Reports that are run one time only.<br />
Page Views<br />
The total number of times a Web page has requested by a user. Page views are counted only when they fully<br />
load into the user's browser window. Pages accessed from the user's local cache are included in page-view<br />
counts. Unique pages will be counted each time they are requested.<br />
Note This option is only used for qualifying users in the Number of Seconds/PVs Internet Segmentation<br />
and not a statistic that is reported.<br />
PCC<br />
Product Category Code<br />
A four-character code, consisting of one letter and three digits, used to group similar products or services.<br />
The first letter of the code indicates the major business category. The last three digits indicate the industry<br />
category, the major category (which further refines the industry category), and the sub-group category (the<br />
most specific category associated with each brand). The following table provides an example of related PCC<br />
codes. The PCC Listing report provides a complete listing of the PCC codes.<br />
Industry Category Major Category Sub-group Category Related Products<br />
F100 F110 F111 Honey, Molasses, Sugar<br />
Foods and food products<br />
Cooking products and<br />
seasonings<br />
Sugars, syrups, and<br />
artificial sweeteners<br />
Parent<br />
A company that owns enough voting stock in another firm to control management and operations by<br />
influencing or electing its board of directors. The Parent company is a consolidation or group of domains and<br />
URLs that are owned by the company, the company's subsidiaries and operating units. In addition, a Parent<br />
may be an organization, government agency, private group, corporation, or other institution, which has<br />
controlling interest in each domain and URL with in the consolidation.<br />
People Meter<br />
An electronic metering device attached to a <strong>TV</strong> set to measure tuning status (set on/off, channel, time, and<br />
duration of tuning) as well as demographic data (who is watching). Household members and their guests<br />
<strong>National</strong> <strong>TV</strong> <strong>Toolbox</strong> <strong>User</strong> <strong>Guide</strong> Glossary • 1-213
push buttons to identify themselves. The People Meter is used by <strong>Nielsen</strong> to measure nationwide audience<br />
measurement in the U.S. and Canada.<br />
Persons Using Television (PUT)<br />
The percentage of all persons or of total persons within a given demographic category in the survey area who<br />
are viewing television during a specific time period.<br />
PESS<br />
See Proportionate Equivalent Sample Size.<br />
POD<br />
A group of spots uninterrupted by program material of significant duration, -n other words, a "commercial<br />
break."<br />
Pod Position<br />
The relative position of one spot to another within a pod, in other words, the sequential order of each spot.<br />
PowerPlay ®<br />
PowerPlay is a desktop research tool used to analyze large data sets. Use PowerPlay in conjunction with<br />
NPOWER to compile data from reports run on the NPOWER scheduler into one large data set for analysis.<br />
PPV<br />
Pay Per View<br />
Pay <strong>TV</strong> for which subscribers pay on a program basis, rather than on a monthly subscription basis.<br />
Primary Feed<br />
As a selection in NPOWER, Primary Feed will use the default feed for each network in calculations. Primary<br />
Feed describes the way a television signal is distributed. The program may be live or prerecorded. Live feed<br />
describes programming that is delivered simultaneously regardless of time zone, for example, a program<br />
airing on the east coast at 8 p.m. will air on the west coast at 5 p.m. local time. Dual feed describes<br />
programming delivered on both the west and east coasts at the same local time, for example, a program<br />
airing on the east coast at 8 p.m. will also air on the west coast at 8 p.m. local time. Broadcast feed is specific<br />
to broadcast networks and follows the pattern as described in the NTI Pocketpiece ® , which depends on the<br />
dominant distribution times by time zone. The feed pattern must be provided by the network in advance. It<br />
must be entered into a descriptor when the program is created.<br />
Program<br />
An offering for entertainment or information, or a collection of related creative events that are broadcast in<br />
one or more telecasts by a media distributor.<br />
Program Indicators<br />
Various attributes for the selected program data.<br />
• A = Acquired (Program/Episode)<br />
• B = Breakout<br />
• C = Complex<br />
• D = Programs < 5 minutes<br />
• G = Gapped<br />
• L = Live<br />
• M = Movie<br />
• N = Non Commercial<br />
• O = Original (Program/Episode)<br />
• P = Premiere<br />
• R = Repeat<br />
• S = Special<br />
• T = Team Sports<br />
• U = Umbrella<br />
• V = Various (Program/Episode)<br />
• X = Unordered Sustainer<br />
Glossary • 1-214<br />
<strong>National</strong> <strong>TV</strong> <strong>Toolbox</strong> <strong>User</strong> <strong>Guide</strong>
• 1 = Long Term<br />
Program Name<br />
The name presented to the television viewer at the time of airing of the program.<br />
Program Type<br />
A category of program for which users can obtain viewing statistics. Some examples of program types are<br />
Adventure, Audience Participation, and Child Day Animation.<br />
Progressive Cume<br />
In a R&F Report, a progressive cume determines the gain in reach, frequency, and gross rating points<br />
(GRPs) achieved with each additional unit within the schedule. You have two options for sort orders in a<br />
progressive cume: Primary Sort or Secondary Sort.<br />
• Primary Sort - Date, Time, Originator Type, Originator, Program Name, Ultimate Parent, Parent,<br />
Brand, Brand Variant, Viewing Source, and Feed Pattern.<br />
• Secondary Sort - Originator Type, Originator, Program Name, Ultimate Parent, Parent, Brand, Brand<br />
Variant, Viewing Source, Feed Pattern, Date, and Time.<br />
Projection<br />
An average audience, expressed in terms of households or persons, derived by multiplying a rating by the<br />
appropriate universe estimate.<br />
Note Projections do not apply to non-currency panels.<br />
Promotional Announcement (Promo)<br />
This content directly relates to the <strong>TV</strong> station or network. It may advertise an upcoming broadcast, identify the<br />
station itself, or promote the image of the station or network.<br />
PESS<br />
Proportionate Equivalent Sample Size (PESS) is the measure of effective change in intab sample size due to<br />
weighting. PESS is only used in the computation of standard errors, and cannot be used in computing sample<br />
composition percentages or audience estimates.<br />
PUT<br />
See Persons Using Television.<br />
Quad<br />
A custom sub-sample created by evenly dividing households or persons into four groupings. Households or<br />
persons are determined to be in a quadrant based on the frequency of their viewing and the duration of their<br />
viewing.<br />
Qualified Audience<br />
Viewers who have met the minimum requirements necessary to be counted as a viewer.<br />
Qualified NCCM AA%<br />
Qualified <strong>National</strong> Commercial Clock Minute AA% is the average rating of all minutes that pass the number of<br />
seconds qualification.<br />
Qualified NCCM Index<br />
Qualified <strong>National</strong> Commercial Clock Minute Index is computed by dividing the appropriate NCCM AA by the<br />
Originator, Program, or Telecast. This number is multiplied by 100 and rounded to whole numbers.<br />
Rating Base<br />
The denominator used in the calculation of viewing estimates.<br />
Ratings<br />
Estimated number of viewers tuned to a program or time period, expressed as a percentage of the universe.<br />
For details on statistics, see the <strong>National</strong> Reference Supplement.<br />
Rating% = Audience Projection ÷ Universe Estimate<br />
<strong>National</strong> <strong>TV</strong> <strong>Toolbox</strong> <strong>User</strong> <strong>Guide</strong> Glossary • 1-215
Reach<br />
The unduplicated number of individuals or households viewing a selected time period, program, or group of<br />
programs. Reach is expressed as a percentage.<br />
Refresh<br />
The process of connecting to the server to update displayed information so it reflects the current status on the<br />
server. Use F5 in Internet Explorer to refresh.<br />
Repeat<br />
Indicates whether a telecast of a program is a repeat of an episode previously aired nationally. This is not<br />
applicable to cable programs.<br />
Report Type<br />
The type of report, for example, Length of Tune, Ratings Analysis, Reach & Frequency, Universe Estimate,<br />
and so forth.<br />
Reportable Network Day<br />
The specific days and times an originator is on the air. This is also referred to as broadcast day.<br />
Documentation on reportable network day can be found on the <strong>Nielsen</strong> Report Library.<br />
Reprocessing<br />
Any processing of lineups that occurs after initial Dailies processing has been completed. Program and<br />
commercial reprocessing is available on <strong>Nielsen</strong> Answers/Media Product Page.<br />
Sample<br />
A subset of <strong>Nielsen</strong> metered households selected to represent the universe.<br />
Scaled Count<br />
The geographically scaled count of the number of intab households/persons within the reported category.<br />
Scaled intab counts enable analysis of sample distribution, including comparison to the <strong>National</strong> Universe<br />
estimates.<br />
Note Does not apply to <strong>TV</strong>/Internet Convergence Research Panel.<br />
Selection Tabs<br />
The thumbnails or rectangular areas of the Specification Definition page used to define criteria for a report<br />
request. The title bar of each thumbnail defines the type of criteria. The asterisk indicates required criteria for<br />
the type of report requested.<br />
Simultaneous<br />
Simultaneous or concurrent usage for <strong>TV</strong> is defined as receiving credit for the specific unit (watching <strong>TV</strong> or<br />
watching a specific network or program) and for Internet as being online or having visited a specific Website<br />
for any duration within that same unit.<br />
Share<br />
Share of Audience (SHR)<br />
A percentage of households using television (HUT) tuned to a particular program or station in a specified<br />
area at a specified time. For details on statistics, see the <strong>National</strong> Reference Supplement.<br />
Share = Program or Time Period Audience ÷ Households Using Television<br />
Share% = (AA% ÷ HUT%) x 100 or (AA% ÷ PUT%) x 100<br />
SMA<strong>TV</strong><br />
Satellite Master Antenna Television<br />
A SMA<strong>TV</strong> usually serves a housing complex or hotel. Here the television signals are received via satellite and<br />
over the air broadcast stations and distributed to the units by coaxial cable. Households may be charged a<br />
fee for maintenance of a SMA<strong>TV</strong>.<br />
SOV<br />
Share of Viewing<br />
Glossary • 1-216<br />
<strong>National</strong> <strong>TV</strong> <strong>Toolbox</strong> <strong>User</strong> <strong>Guide</strong>
Share of viewing is used to examine the viewing from one source against the viewing from all other viewing<br />
sources selected for specified dayparts and/or demographics. This is the percentage (%) of the sum of all<br />
viewing sources selected in the specification.<br />
Specification Definition Page<br />
The Specification Definition page is the first page displayed after selecting a report type from the <strong>National</strong> <strong>TV</strong><br />
<strong>Toolbox</strong> home page.<br />
Spot-based Schedules (Advertisement or Program Schedules)<br />
Advertisement or program schedules that have only unit durations that are equal to one minute. These<br />
schedules should be processed with a one-minute qualified audience.<br />
Standard <strong>Nielsen</strong> Day<br />
The 6:00 a.m. to 6:00 a.m. time frame for which <strong>Nielsen</strong> measures programming.<br />
Status<br />
A description of the current processing state of a report request.<br />
Streaming<br />
Consumption of Internet-delivered video watched while online.<br />
Sustainer<br />
Applicable to NTI or NSS programs. Designation given to programs where no national commercials are<br />
offered for sale. Audience estimates are produced for these sustaining programs beginning September 20,<br />
2010 going forward.<br />
Syndicated Television<br />
A television program that is available for telecast by individual stations. The program source can either be a<br />
national commercial distributor or a nonprofit organization.<br />
Syndicator<br />
A distributor of television programs that are generally filmed or taped series available for telecast by individual<br />
stations.<br />
TA<br />
Total Audience<br />
Percent of households tuning to all or to any portion of a program for at least 6 minutes.<br />
Telecast<br />
A program airing on a specific date and time.<br />
Time Shifted Viewing (TSV)<br />
Viewing television content at a time other than when it aired.<br />
Total Internet Usage<br />
Internet navigation (browser-based surfing and browser-based applications) and video streaming use.<br />
Trackage<br />
An optional label assigned to a group of telecasts for a program that indicates when they air. Allows for<br />
differentiation of multiple telecasts of one program within the same day or week. For example, "Movie<br />
Showcase M-F" or "Movie Showcase Wknd."<br />
TSV<br />
See Time Shifted Viewing.<br />
<strong>TV</strong>/Internet Convergence Research Panel<br />
<strong>Nielsen</strong>'s research panel where <strong>TV</strong> and Internet usage are both measured directly.<br />
<strong>National</strong> <strong>TV</strong> <strong>Toolbox</strong> <strong>User</strong> <strong>Guide</strong> Glossary • 1-217
<strong>TV</strong>/Internet Data Fusion<br />
Using a statistical matching process to link television audience information and Internet usage, <strong>Nielsen</strong>'s <strong>TV</strong>/<br />
Internet Data Fusion reports both national television viewing data and Website usage in a single dataset.<br />
UE<br />
Universe Estimate<br />
The statistically derived estimate of a total population of households or persons. These represent subsets of<br />
the population that may be based on demographic categories or coverage areas.<br />
UE Type<br />
The UE Type is either S for standard published universe estimate or C for calculated/custom universe<br />
estimate. The calculated/custom UE is only available in NPOWER.<br />
Unclassified<br />
Low-penetration Websites that have not yet been classified in <strong>Nielsen</strong> Online's MarketView dictionary.<br />
Unification<br />
A process that is used to produce a sample of usable people meter households/persons for a specified<br />
number of days. Unification places restrictions on homes included in a sample. Only homes that provide<br />
usable information, referred to as intab, which meet the minimum requirements for the selected percent of<br />
days in the measurement interval, are included.<br />
Unit<br />
A unit determines how you want the minutes within a schedule grouped or broken out into units, which are<br />
rows in the schedule. Units can be many things depending on the schedule type but the typical units are:<br />
Advertisement Schedule = Spot/Commercial Occurrence, Time Period Schedule = Day Daypart, Program<br />
Schedule = Telecast, and Internet Schedule = Website by Day Daypart.<br />
Usage Data<br />
Data pertaining to total usage or households using television (HUT).<br />
US AA%<br />
Average Audience<br />
An average of the viewing audience for each minute of a program or daypart, expressed as a percentage or<br />
as an estimated number of households or persons.<br />
AA% = Weighted Viewing ÷ Weighted Intab x 100<br />
Effective 1/31/11, includes duplicate viewing for playback. Effective 4/25/2011, includes any eligible PC<br />
contribution for extended screen.<br />
VCR<br />
Video Cassette Recorder<br />
A market section with market breaks of VCR Owner or Non VCR Owner.<br />
Video Streaming Only<br />
This selection on the Internet Source page provides results for only streaming usage, which is Internetdelivered<br />
video watched while online. A subtraction of Video Streaming Only from Total Internet Usage will<br />
not result in an accurate set of non-streaming usage due to variations in collection and business rules for<br />
each usage type.<br />
Viewing Source<br />
A measure of a category of viewing within the total U.S. or the coverage area of the cable originator being<br />
measured.<br />
Viewing Type<br />
Identifies the stream of data selected for reporting: Live, Live+SD, Live+7, or Most Current.<br />
Glossary • 1-218<br />
<strong>National</strong> <strong>TV</strong> <strong>Toolbox</strong> <strong>User</strong> <strong>Guide</strong>
VOD<br />
Video on Demand<br />
This is a program provided to MSOs to be aired On Demand by the household viewer. VOD is sometimes<br />
known as MOD (Movie on Demand) or SVOD (Subscription Video on Demand).<br />
VOD Coverage Area<br />
Any home capable of receiving one or more On Demand sources via a service provider.<br />
VPMH<br />
Viewers Per Market Break Household<br />
The projected number of viewers per 1,000 market breaks households for the average minutes of a selected<br />
program or time period.<br />
VPVH<br />
Viewers Per Viewing Household<br />
The projected number of viewers per 1,000 projected households passing person edits for the average<br />
minutes of a selected program or time period.<br />
Website<br />
Destinations on the Web classified in <strong>Nielsen</strong> Online's NetView/MarketView dictionary as Parents, Brands,<br />
Channels, Categories, and Sub-categories.<br />
Weighted Intab<br />
The sum of each intab home multiplied by its weight in the sample.<br />
Weighted NCCM AA%<br />
Weighted <strong>National</strong> Commercial Clock Minute AA% is a rating weighted by the number of national commercial<br />
seconds in each minute that passes the number of seconds qualification.<br />
Weighted NCCM Index<br />
Weighted <strong>National</strong> Commercial Clock Minute Index is computed by dividing the appropriate NCCM AA by the<br />
originator, program, or telecast AA. The number is multiplied by 100 and rounded to whole numbers.<br />
Weighted Viewing<br />
The sum of each intab home's viewing minutes for a given day, multiplied by that home's weight in the<br />
sample for that day.<br />
WESE<br />
Weighted Effect on Standard Error<br />
The estimated effect on standard error resulting from the variance of the household or persons weights.<br />
<strong>National</strong> <strong>TV</strong> <strong>Toolbox</strong> <strong>User</strong> <strong>Guide</strong> Glossary • 1-219
Glossary • 1-220<br />
<strong>National</strong> <strong>TV</strong> <strong>Toolbox</strong> <strong>User</strong> <strong>Guide</strong>
Index<br />
A<br />
AA ................................................................................134<br />
about ..................................................................................<br />
18, 20, 22, 34, 35, 40, 66, 70, 83, 87, 88, 96,<br />
102, 151, 155, 162, 164, 166, 169, 180,<br />
182–184, 191<br />
Boolean logic ..........................................................88<br />
co-viewing ...............................................................22<br />
combos ...................................................................96<br />
criteria selection pages ...........................................83<br />
criteria selection toolbar ..........................................87<br />
cross .....................................................................102<br />
cross selected .......................................................102<br />
data fusion ............................................................191<br />
demographics .......................................................151<br />
duplication reports ................................................164<br />
groups .....................................................................96<br />
Internet segmentation ...........................................184<br />
length of tune reports ..............................................22<br />
market breaks .......................................................155<br />
MarketBreaks ..................................................34<br />
reports ......................................................34<br />
NOM segmentation ...............................................183<br />
NPOWER ................................................................18<br />
NTile segmentation ...............................................183<br />
quad segmentation ...............................................182<br />
R&F reports ..........................................................162<br />
report specifications ................................................70<br />
report types .......................................................20, 35<br />
schedules ..............................................................169<br />
segmentation reports ............................................180<br />
SSG ........................................................................40<br />
unification ..............................................................166<br />
universe estimates ..................................................66<br />
advertisements .............................................................124<br />
page, field descriptions .........................................124<br />
AND ...............................................................................88<br />
AOT ..............................................................................205<br />
B<br />
Boolean ..............................................................88, 90, 92<br />
about .......................................................................88<br />
nested expression ...................................................92<br />
using operators .......................................................90<br />
using with a combo .................................................88<br />
builder ..........................................................................107<br />
jobs page, field descriptions .................................107<br />
building schedules .......................................................120<br />
C<br />
C3 ................................................................................206<br />
calendar .................................................................14, 112<br />
default service .........................................................14<br />
measurement intervals .........................................112<br />
co-viewing ..............................................................22, 154<br />
about .......................................................................22<br />
co-view pairs .........................................................154<br />
combine .......................................................................101<br />
combos ..................................................96, 101, 103, 104<br />
about .......................................................................96<br />
creating .................................................101, 103, 104<br />
retain combo parts ..................................................96<br />
counts ..................................................................200–202<br />
daily intab ..............................................................200<br />
daily scaled installed .............................................201<br />
daily scaled intab ..................................................202<br />
coverage areas ............................................................157<br />
criteria selection pages ..................................................83<br />
criteria selection toolbar .................................................87<br />
cross ............................................................................103<br />
cross and cross selected, about ..................................102<br />
cross selected ..............................................................104<br />
cross-platform ......................................................190, 191<br />
data fusion ............................................................191<br />
service - single source ..........................................190<br />
custom coverage areas ................................................157<br />
page, field descriptions .........................................157<br />
custom projections ...................................................14, 66<br />
D<br />
data ..............................................................................112<br />
measurement interval page ..................................112<br />
data availability ..............................................................42<br />
displaying ................................................................42<br />
data fusion ...........................................................191, 192<br />
about .....................................................................191<br />
frequently asked questions ...................................192<br />
dayparts ...............................................................126, 149<br />
custom ..................................................................126<br />
page, field descriptions .........................................149<br />
standard dayparts .................................................126<br />
defaults, setting ..............................................................14<br />
deleting ....................................................75, 98, 175, 176<br />
all schedule executions .........................................176<br />
groups .....................................................................98<br />
schedules ..............................................................175<br />
specification ............................................................75<br />
demographics ................................................63, 151, 152<br />
about .....................................................................151<br />
descriptions .............................................................63<br />
page, field descriptions .........................................152<br />
distinct processing .........................................................14<br />
duplication reports ........................................................164<br />
about .....................................................................164<br />
E<br />
e-mail options .................................................................14<br />
editing ....................................................................72, 173<br />
report specifications ................................................72<br />
schedules ..............................................................173<br />
<strong>National</strong> <strong>TV</strong> <strong>Toolbox</strong> <strong>User</strong> <strong>Guide</strong> Index • 221
F<br />
FAQs ................................................................24, 36, 192<br />
data fusion ............................................................192<br />
marketbreaks ..........................................................36<br />
NPOWER ................................................................24<br />
feed pattern ..................................................................140<br />
page, field descriptions .........................................140<br />
filter ..............................................................108, 126, 174<br />
applying to a schedule ..........................................174<br />
page, field descriptions .........................................108<br />
program ................................................................126<br />
format ...........................................................................159<br />
page, field descriptions .........................................159<br />
frequency distribution ...................................................141<br />
page, field descriptions .........................................141<br />
frequently asked questions ..............................24, 36, 192<br />
cross-platform data fusion ....................................192<br />
marketbreaks ..........................................................36<br />
NPOWER ................................................................24<br />
G<br />
GAA .....................................................................126, 134<br />
programs page ......................................................126<br />
statistics page .......................................................134<br />
groups ..............................................................96, 98–100<br />
about .......................................................................96<br />
creating ...................................................................99<br />
creating from shared reports .................................100<br />
working with ............................................................98<br />
H<br />
home page .....................................................................14<br />
household characteristics ............................................155<br />
I<br />
intab counts ..........................................................200–202<br />
daily ......................................................................200<br />
daily scaled ...........................................................202<br />
daily scaled installed .............................................201<br />
Internet source .............................................................148<br />
page, field descriptions .........................................148<br />
L<br />
length of tune reports .....................................................22<br />
linear ............................................................................210<br />
Live+7 ..........................................................................109<br />
LOT/LOV ........................................................................22<br />
M<br />
MAMI ............................................................................210<br />
market breaks ................................................43, 155, 156<br />
about .....................................................................155<br />
descriptions .............................................................43<br />
page, field descriptions .........................................156<br />
profile ....................................................................156<br />
segmentation ........................................................156<br />
market section ........................................................43, 155<br />
MarketBreaks .................................................................36<br />
frequently asked questions .....................................36<br />
MarketBreaks reports .....................................................34<br />
measurement interval ..................................................112<br />
page, field descriptions .........................................112<br />
media source ...............................................................110<br />
median age/median income .........................................210<br />
menu bar ........................................................................14<br />
most current .................................................................109<br />
N<br />
national commercial clock minute ................................134<br />
national reference supplement .....................................204<br />
viewing ..................................................................204<br />
navigation pane ..............................................................14<br />
nested boolean ..............................................................92<br />
NOM sementation ........................................................183<br />
NOT ...............................................................................88<br />
NPOWER .......................................................................18<br />
about .......................................................................18<br />
NTile segmentation ......................................................183<br />
O<br />
options ...........................................................................85<br />
page ........................................................................85<br />
OR ..................................................................................88<br />
P<br />
page options ..................................................................85<br />
PESS ...........................................................................203<br />
playback periods ..........................................................110<br />
page, field descriptions .........................................110<br />
PowerPlay ......................................................................20<br />
preferences, user ...........................................................14<br />
program details ............................................................145<br />
page, field descriptions .........................................145<br />
program indicators .......................................................145<br />
program reports .............................................................17<br />
programs ......................................................................126<br />
page, field descriptions .........................................126<br />
progressive cume .........................................................134<br />
statistics ................................................................134<br />
proportionate equivalent sample size ..........................203<br />
Q<br />
quads ...........................................................................182<br />
qualified audience ..................................................14, 134<br />
setting default minutes ............................................14<br />
unique minutes .....................................................134<br />
R<br />
R&F reports ..........................................162, 164–166, 169<br />
about .....................................................................162<br />
creating .................................................................165<br />
Index • 222<br />
<strong>National</strong> <strong>TV</strong> <strong>Toolbox</strong> <strong>User</strong> <strong>Guide</strong>
duplication .............................................................164<br />
schedules ..............................................................169<br />
unification ..............................................................166<br />
R&F schedule page .....................................................170<br />
ranking .........................................................................158<br />
page, field descriptions .........................................158<br />
ratings analyses .......................................................20, 35<br />
MarketBreaks ..........................................................35<br />
NPOWER ................................................................20<br />
reach and frequency ............................................162, 164<br />
duplication report ..................................................164<br />
R&F report ............................................................162<br />
recurring reports .............................................75, 112, 188<br />
deleting ...................................................................75<br />
modifying ..............................................................188<br />
scheduling .............................................................112<br />
report segment .............................................................142<br />
page, field descriptions .........................................142<br />
report types ..............................................................20, 35<br />
MarketBreaks ..........................................................35<br />
NPOWER ................................................................20<br />
reports ................................................14, 72–75, 112, 187<br />
deleting recurring ....................................................75<br />
editing .....................................................................72<br />
output ......................................................................14<br />
scheduling .............................................................112<br />
sharing ....................................................................73<br />
unsharing ................................................................74<br />
viewing ..................................................................187<br />
resolution .......................................................................12<br />
S<br />
sample .........................................................................106<br />
page ......................................................................106<br />
schedule .......................................................................120<br />
page, field descriptions .........................................120<br />
schedule pairs ..............................................................133<br />
page, field descriptions .........................................133<br />
schedule report ............................................................112<br />
measurement interval page ..................................112<br />
schedules .............................................132, 169, 172–177<br />
about .....................................................................169<br />
building .................................................................172<br />
deactivating ...........................................................177<br />
deleting .........................................................175, 176<br />
filtering ..................................................................174<br />
page, field descriptions .........................................132<br />
viewing or editing ..................................................173<br />
segmentation ...............................................129, 180–184<br />
about .....................................................................180<br />
Internet ..................................................................184<br />
NOM .....................................................................183<br />
NTile .....................................................................183<br />
page, field descriptions .........................................129<br />
quads ....................................................................182<br />
using in other reports ............................................181<br />
segmentation reports ...................................................156<br />
market breaks .......................................................156<br />
selection tabs ...........................................................78, 85<br />
functions available on .............................................85<br />
sharing ...................................................................73, 100<br />
groups ...................................................................100<br />
specifications ..........................................................73<br />
simultaneous duplication report ...................................164<br />
source and destination ...................................................20<br />
SOV .............................................................................134<br />
specifications .....................................................70–75, 78<br />
about .......................................................................70<br />
creating ...................................................................71<br />
deleting ...................................................................75<br />
selection tabs ..........................................................78<br />
sharing ..............................................................71, 73<br />
specification definition page ....................................70<br />
unsharing ................................................................74<br />
viewing or editing ....................................................72<br />
SSG .......................................................................40, 202<br />
about .......................................................................40<br />
daily scaled intab counts .......................................202<br />
standard dayparts ........................................................126<br />
statistics ...............................................................134, 158<br />
page, statistic definitions .......................................134<br />
ranking ..................................................................158<br />
status, report ................................................................186<br />
subscriptions ..................................................................67<br />
system requirements ......................................................12<br />
T<br />
time period reports .........................................................17<br />
time-shifted viewing .....................................................109<br />
viewing type ..........................................................109<br />
trackage ...............................................................126, 142<br />
program advanced filter ........................................126<br />
report segment ......................................................142<br />
trend analysis .................................................................35<br />
TSV ..............................................................................217<br />
U<br />
UE ..................................................................................66<br />
unification .............................................................116, 166<br />
about .....................................................................166<br />
page. field descriptions .........................................116<br />
unified sample ......................................................118, 168<br />
creating .................................................................168<br />
page, field descriptions .........................................118<br />
universe estimates .........................................................66<br />
unsharing .......................................................................74<br />
user preferences ............................................................14<br />
V<br />
viewing .........................................................173, 187, 204<br />
national reference supplement .............................204<br />
reports ...................................................................187<br />
schedules ..............................................................173<br />
viewing source .............................................................150<br />
page, field descriptions .........................................150<br />
viewing type .................................................................109<br />
page, field descriptions .........................................109<br />
<strong>National</strong> <strong>TV</strong> <strong>Toolbox</strong> <strong>User</strong> <strong>Guide</strong> Index • 223
W<br />
websites .......................................................................119<br />
page, field descriptions .........................................119<br />
Z<br />
zipping files ....................................................................14<br />
Index • 224<br />
<strong>National</strong> <strong>TV</strong> <strong>Toolbox</strong> <strong>User</strong> <strong>Guide</strong>