2011 Annual Report PDF - Tullow Oil plc
2011 Annual Report PDF - Tullow Oil plc
2011 Annual Report PDF - Tullow Oil plc

You also want an ePaper? Increase the reach of your titles
YUMPU automatically turns print PDFs into web optimized ePapers that Google loves.
Notes to the Group financial statements<br />
Year ended 31 December <strong>2011</strong><br />
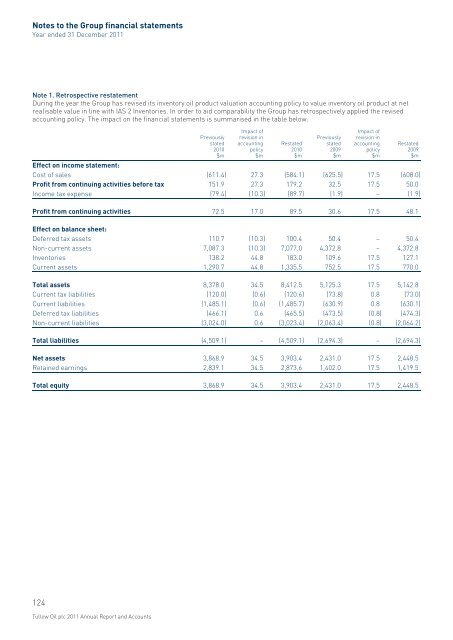
Note 1. Retrospective restatement<br />
During the year the Group has revised its inventory oil product valuation accounting policy to value inventory oil product at net<br />
realisable value in line with IAS 2 Inventories. In order to aid comparability the Group has retrospectively applied the revised<br />
accounting policy. The impact on the financial statements is summarised in the table below.<br />
Previously<br />
stated<br />
2010<br />
$m<br />
Impact of<br />
revision in<br />
accounting<br />
policy<br />
$m<br />
Restated<br />
2010<br />
$m<br />
Previously<br />
stated<br />
2009<br />
$m<br />
Impact of<br />
revision in<br />
accounting<br />
policy<br />
$m<br />
Restated<br />
2009<br />
$m<br />
Effect on income statement:<br />
Cost of sales (611.4) 27.3 (584.1) (625.5) 17.5 (608.0)<br />
Profit from continuing activities before tax 151.9 27.3 179.2 32.5 17.5 50.0<br />
Income tax expense (79.4) (10.3) (89.7) (1.9) – (1.9)<br />
Profit from continuing activities 72.5 17.0 89.5 30.6 17.5 48.1<br />
Effect on balance sheet:<br />
Deferred tax assets 110.7 (10.3) 100.4 50.4 – 50.4<br />
Non-current assets 7,087.3 (10.3) 7,077.0 4,372.8 – 4,372.8<br />
Inventories 138.2 44.8 183.0 109.6 17.5 127.1<br />
Current assets 1,290.7 44.8 1,335.5 752.5 17.5 770.0<br />
Total assets 8,378.0 34.5 8,412.5 5,125.3 17.5 5,142.8<br />
Current tax liabilities (120.0) (0.6) (120.6) (73.8) 0.8 (73.0)<br />
Current liabilities (1,485.1) (0.6) (1,485.7) (630.9) 0.8 (630.1)<br />
Deferred tax liabilities (466.1) 0.6 (465.5) (473.5) (0.8) (474.3)<br />
Non-current liabilities (3,024.0) 0.6 (3,023.4) (2,063.4) (0.8) (2,064.2)<br />
Total liabilities (4,509.1) – (4,509.1) (2,694.3) – (2,694.3)<br />
Net assets 3,868.9 34.5 3,903.4 2,431.0 17.5 2,448.5<br />
Retained earnings 2,839.1 34.5 2,873.6 1,402.0 17.5 1,419.5<br />
Total equity 3,868.9 34.5 3,903.4 2,431.0 17.5 2,448.5<br />
124<br />
<strong>Tullow</strong> <strong>Oil</strong> <strong>plc</strong> <strong>2011</strong> <strong>Annual</strong> <strong>Report</strong> and Accounts