2011 Annual Report PDF - Tullow Oil plc
2011 Annual Report PDF - Tullow Oil plc
2011 Annual Report PDF - Tullow Oil plc

You also want an ePaper? Increase the reach of your titles
YUMPU automatically turns print PDFs into web optimized ePapers that Google loves.
More information<br />
Page<br />
Long-term performance risks 43<br />
1<br />
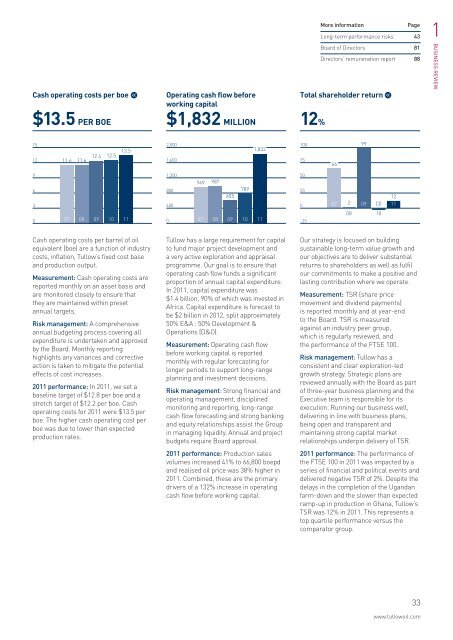
Cash operating costs per boe<br />
$13.5 PER BOE<br />
Operating cash flow before<br />
working capital<br />
$1,832 MILLION<br />
Total shareholder return<br />
12%<br />
Board of Directors 81<br />
Directors’ remuneration report 88<br />
BUSINESS REVIEW<br />
15<br />
12<br />
11.6<br />
11.6<br />
12.4<br />
12.5<br />
13.5<br />
2,000<br />
1,600<br />
1,832<br />
100<br />
75<br />
66<br />
99<br />
9<br />
6<br />
3<br />
0<br />
07 08 09 10 11<br />
1,200<br />
800<br />
400<br />
0<br />
949<br />
987<br />
605<br />
789<br />
07 08 09 10 11<br />
50<br />
25<br />
0<br />
-25<br />
12<br />
07 2 09 (3) 11<br />
08 10<br />
Cash operating costs per barrel of oil<br />
equivalent (boe) are a function of industry<br />
costs, inflation, <strong>Tullow</strong>’s fixed cost base<br />
and production output.<br />
Measurement: Cash operating costs are<br />
reported monthly on an asset basis and<br />
are monitored closely to ensure that<br />
they are maintained within preset<br />
annual targets.<br />
Risk management: A comprehensive<br />
annual budgeting process covering all<br />
expenditure is undertaken and approved<br />
by the Board. Monthly reporting<br />
highlights any variances and corrective<br />
action is taken to mitigate the potential<br />
effects of cost increases.<br />
<strong>2011</strong> performance: In <strong>2011</strong>, we set a<br />
baseline target of $12.8 per boe and a<br />
stretch target of $12.2 per boe. Cash<br />
operating costs for <strong>2011</strong> were $13.5 per<br />
boe. The higher cash operating cost per<br />
boe was due to lower than expected<br />
production rates.<br />
<strong>Tullow</strong> has a large requirement for capital<br />
to fund major project development and<br />
a very active exploration and appraisal<br />
programme. Our goal is to ensure that<br />
operating cash flow funds a significant<br />
proportion of annual capital expenditure.<br />
In <strong>2011</strong>, capital expenditure was<br />
$1.4 billion, 90% of which was invested in<br />
Africa. Capital expenditure is forecast to<br />
be $2 billion in 2012, split approximately<br />
50% E&A : 50% Development &<br />
Operations (D&O).<br />
Measurement: Operating cash flow<br />
before working capital is reported<br />
monthly with regular forecasting for<br />
longer periods to support long-range<br />
planning and investment decisions.<br />
Risk management: Strong financial and<br />
operating management, disciplined<br />
monitoring and reporting, long-range<br />
cash flow forecasting and strong banking<br />
and equity relationships assist the Group<br />
in managing liquidity. <strong>Annual</strong> and project<br />
budgets require Board approval.<br />
<strong>2011</strong> performance: Production sales<br />
volumes increased 41% to 66,800 boepd<br />
and realised oil price was 38% higher in<br />
<strong>2011</strong>. Combined, these are the primary<br />
drivers of a 132% increase in operating<br />
cash flow before working capital.<br />
Our strategy is focused on building<br />
sustainable long-term value growth and<br />
our objectives are to deliver substantial<br />
returns to shareholders as well as fulfil<br />
our commitments to make a positive and<br />
lasting contribution where we operate.<br />
Measurement: TSR (share price<br />
movement and dividend payments)<br />
is reported monthly and at year-end<br />
to the Board. TSR is measured<br />
against an industry peer group,<br />
which is regularly reviewed, and<br />
the performance of the FTSE 100.<br />
Risk management: <strong>Tullow</strong> has a<br />
consistent and clear exploration-led<br />
growth strategy. Strategic plans are<br />
reviewed annually with the Board as part<br />
of three-year business planning and the<br />
Executive team is responsible for its<br />
execution. Running our business well,<br />
delivering in line with business plans,<br />
being open and transparent and<br />
maintaining strong capital market<br />
relationships underpin delivery of TSR.<br />
<strong>2011</strong> performance: The performance of<br />
the FTSE 100 in <strong>2011</strong> was impacted by a<br />
series of financial and political events and<br />
delivered negative TSR of 2%. Despite the<br />
delays in the completion of the Ugandan<br />
farm-down and the slower than expected<br />
ramp-up in production in Ghana, <strong>Tullow</strong>‘s<br />
TSR was 12% in <strong>2011</strong>. This represents a<br />
top quartile performance versus the<br />
comparator group.<br />
33<br />
www.tullowoil.com