2011 Annual Report PDF - Tullow Oil plc
2011 Annual Report PDF - Tullow Oil plc
2011 Annual Report PDF - Tullow Oil plc

Create successful ePaper yourself
Turn your PDF publications into a flip-book with our unique Google optimized e-Paper software.
5<br />
Financial derivatives<br />
The Group internally measures its market risk exposure by running various sensitivity analyses, including utilising<br />
10% favourable and adverse changes in the key variables.<br />
<strong>Oil</strong> and gas sensitivity analysis<br />
The following analysis, required by IFRS 7, is intended to illustrate the sensitivity to changes in market variables, being dated<br />
Brent oil prices and UK D-1 Heren and M-1 Heren natural gas prices. The sensitivity analysis, which is used internally by<br />
management to monitor financial derivatives, has been prepared using the following assumptions:<br />
The pricing adjustments relate only to the point forward mark-to-market (MTM) evaluations;<br />
The price sensitivities assume there is no ineffectiveness related to the oil and gas hedges; and<br />
The sensitivities have been run only on the intrinsic element of the hedge as management consider this to be the material<br />
component of the MTM oil and gas hedges.<br />
As at 31 December <strong>2011</strong>, a 10% increase in the dated Brent oil price curve would have decreased equity (only adjusting the<br />
intrinsic value element) by approximately $17.8 million (2010: $21.8 million), a 10% decrease would have increased equity<br />
by approximately $7.2 million (2010: $5.9 million).<br />
As at 31 December <strong>2011</strong>, a 10% increase in the UK D-1 Heren and M-1 Heren natural gas price curves would have decreased<br />
equity by approximately $3.3 million (2010: $8.6 million), a 10% decrease would have increased equity by approximately<br />
$2.0 million (2010: $3.4 million).<br />
Interest rate sensitivity analysis<br />
As at 31 December <strong>2011</strong>, the interest rate derivative position was out-of-the-money to an amount of $7.2 million<br />
(2010: $13.6 million); a 25bps increase in the underlying interest rate would increase equity by approximately $0.5 million<br />
(2010: $1.2 million).<br />
Credit risk<br />
Credit risk refers to the risk that the counterparty will fail to perform or fail to pay amounts due, resulting in financial loss to the<br />
Group. The primary activities of the Group are oil and gas exploration and production. The Group has a credit policy that governs<br />
the management of credit risk, including the establishment of counterparty credit limits and specific transaction approvals. The<br />
Group limits credit risk by assessing creditworthiness of potential counterparties before entering into transactions with them<br />
and continuing to evaluate their creditworthiness after transactions have been initiated. The Group attempts to mitigate credit<br />
risk by entering into contracts that permit netting and allow for termination of the contract upon the occurrence of certain events<br />
of default. The Group’s exposure and the credit ratings of its counterparties are continuously monitored and the aggregate value<br />
of transactions concluded is spread amongst approved counterparties.<br />
The Group does not have any significant credit risk exposure to any single counterparty or any group of counterparties having<br />
similar characteristics. The maximum financial exposure due to credit risk on the Group’s financial assets, representing the sum<br />
of cash and cash equivalents, investments, derivative assets, trade receivables and other current assets, as at 31 December <strong>2011</strong><br />
was $1,254.2 million (2010: $1,153.0 million).<br />
FINANCIAL STATEMENTS<br />
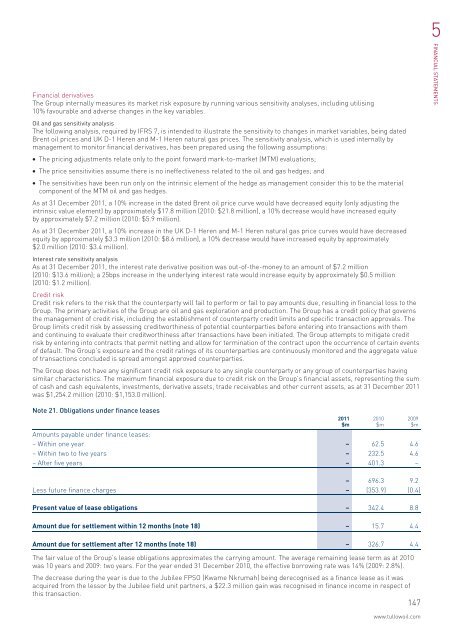
Note 21. Obligations under finance leases<br />
Amounts payable under finance leases:<br />
– Within one year – 62.5 4.6<br />
– Within two to five years – 232.5 4.6<br />
– After five years – 401.3 –<br />
– 696.3 9.2<br />
Less future finance charges – (353.9) (0.4)<br />
Present value of lease obligations – 342.4 8.8<br />
Amount due for settlement within 12 months (note 18) – 15.7 4.4<br />
Amount due for settlement after 12 months (note 18) – 326.7 4.4<br />
The fair value of the Group’s lease obligations approximates the carrying amount. The average remaining lease term as at 2010<br />
was 10 years and 2009: two years. For the year ended 31 December 2010, the effective borrowing rate was 14% (2009: 2.8%).<br />
The decrease during the year is due to the Jubilee FPSO (Kwame Nkrumah) being derecognised as a finance lease as it was<br />
acquired from the lessor by the Jubilee field unit partners, a $22.3 million gain was recognised in finance income in respect of<br />
this transaction.<br />
147<br />
<strong>2011</strong><br />
$m<br />
2010<br />
$m<br />
2009<br />
$m<br />
www.tullowoil.com