2011 Annual Report PDF - Tullow Oil plc
2011 Annual Report PDF - Tullow Oil plc
2011 Annual Report PDF - Tullow Oil plc

Create successful ePaper yourself
Turn your PDF publications into a flip-book with our unique Google optimized e-Paper software.
Financial results and KPI summary<br />
<strong>2011</strong> 2010 Change<br />
1<br />
BUSINESS REVIEW<br />
Working interest production (boepd) 78,200 58,100 +35%<br />
Sales volume (boepd) 66,800 47,400 +41%<br />
Realised oil price per barrel ($) 108.0 78.0 +38%<br />
Realised gas price per therm (pence) 57.0 42.0 +36%<br />
Sales revenue ($m) 2,304 1,090 +111%<br />
Cash operating costs per boe ($) 1 13.5 12.5 +8%<br />
Operating profit ($m) 2 1,132 262 +332%<br />
Profit from continuing activities before tax ($m) 2 1,073 179 +499%<br />
Profit for the year from continuing activities ($m) 2 689 90 +670%<br />
Basic earnings per share (cents) 2 72.5 8.1 +795%<br />
Cash generated from operations ($m) 3 1,832 789 +132%<br />
Operating cash flow per boe ($) 3 64.2 37.2 +73%<br />
Dividend per share (pence) 12.0 6.0 +100%<br />
Capital investment ($m) 4 1,432 1,235 +16%<br />
Year-end net debt ($m) 5 2,854 1,943 +47%<br />
Interest cover (times) 6 16.7 14.3 2.4 times<br />
Gearing (%) 7 60 50 +10%<br />
1. Cash operating costs are cost of sales excluding depletion, depreciation<br />
and amortisation and under/overlift movements.<br />
2. 2010 has been restated to reflect a change in accounting policy with<br />
regard to inventory valuation.<br />
3. Before working capital movements.<br />
4. <strong>2011</strong> capital investment excludes the Nuon and EO Group acquisitions.<br />
5. Net debt is cash and cash equivalents less financial liabilities.<br />
6. Interest cover is earnings before interest, tax, depreciation and amortisation<br />
charges and exploration written-off divided by net finance costs.<br />
7. Gearing is net debt divided by net assets.<br />
Production, commodity prices and revenue<br />
Working interest production averaged 78,200 boepd, an increase<br />
of 35% for the year (2010: 58,100 boepd). This reflects increasing<br />
production from the Jubilee field in Ghana, where First <strong>Oil</strong> was<br />
achieved in November 2010. Sales volumes averaged 66,800<br />
boepd, up 41% compared to 2010.<br />
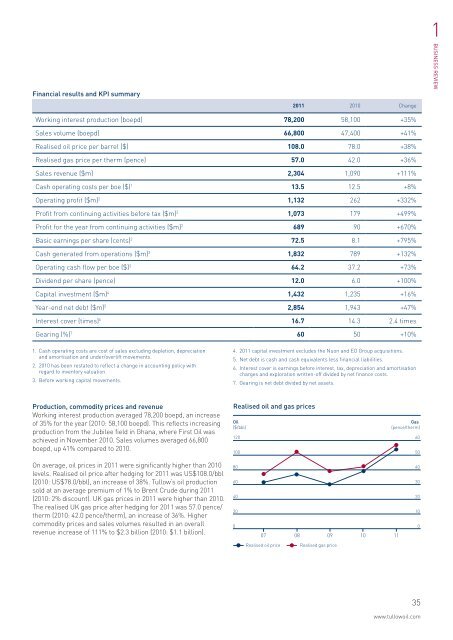
Realised oil and gas prices<br />
<strong>Oil</strong><br />
($/bbl)<br />
120<br />
100<br />
Gas<br />
(pence/therm)<br />
60<br />
50<br />
On average, oil prices in <strong>2011</strong> were significantly higher than 2010<br />
levels. Realised oil price after hedging for <strong>2011</strong> was US$108.0/bbl<br />
(2010: US$78.0/bbl), an increase of 38%. <strong>Tullow</strong>’s oil production<br />
sold at an average premium of 1% to Brent Crude during <strong>2011</strong><br />
(2010: 2% discount). UK gas prices in <strong>2011</strong> were higher than 2010.<br />
The realised UK gas price after hedging for <strong>2011</strong> was 57.0 pence/<br />
therm (2010: 42.0 pence/therm), an increase of 36%. Higher<br />
commodity prices and sales volumes resulted in an overall<br />
revenue increase of 111% to $2.3 billion (2010: $1.1 billion).<br />
80<br />
60<br />
40<br />
20<br />
0<br />
07 08 09 10<br />
11<br />
40<br />
30<br />
20<br />
10<br />
0<br />
Realised oil price<br />
Realised gas price<br />
35<br />
www.tullowoil.com