2011 Annual Report PDF - Tullow Oil plc
2011 Annual Report PDF - Tullow Oil plc
2011 Annual Report PDF - Tullow Oil plc

Create successful ePaper yourself
Turn your PDF publications into a flip-book with our unique Google optimized e-Paper software.
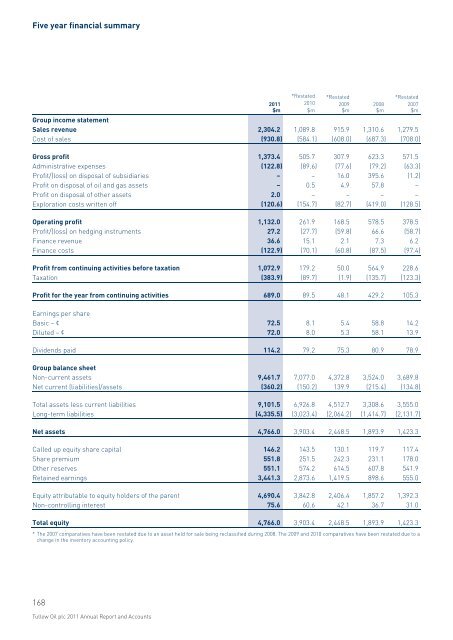
Five year financial summary<br />
<strong>2011</strong><br />
$m<br />
*Restated<br />
2010<br />
$m<br />
*Restated<br />
2009<br />
$m<br />
2008<br />
$m<br />
*Restated<br />
2007<br />
$m<br />
Group income statement<br />
Sales revenue 2,304.2 1,089.8 915.9 1,310.6 1,279.5<br />
Cost of sales (930.8) (584.1) (608.0) (687.3) (708.0)<br />
Gross profit 1,373.4 505.7 307.9 623.3 571.5<br />
Administrative expenses (122.8) (89.6) (77.6) (79.2) (63.3)<br />
Profit/(loss) on disposal of subsidiaries – – 16.0 395.6 (1.2)<br />
Profit on disposal of oil and gas assets – 0.5 4.9 57.8 –<br />
Profit on disposal of other assets 2.0 – – – –<br />
Exploration costs written off (120.6) (154.7) (82.7) (419.0) (128.5)<br />
Operating profit 1,132.0 261.9 168.5 578.5 378.5<br />
Profit/(loss) on hedging instruments 27.2 (27.7) (59.8) 66.6 (58.7)<br />
Finance revenue 36.6 15.1 2.1 7.3 6.2<br />
Finance costs (122.9) (70.1) (60.8) (87.5) (97.4)<br />
Profit from continuing activities before taxation 1,072.9 179.2 50.0 564.9 228.6<br />
Taxation (383.9) (89.7) (1.9) (135.7) (123.3)<br />
Profit for the year from continuing activities 689.0 89.5 48.1 429.2 105.3<br />
Earnings per share<br />
Basic – ¢ 72.5 8.1 5.4 58.8 14.2<br />
Diluted – ¢ 72.0 8.0 5.3 58.1 13.9<br />
Dividends paid 114.2 79.2 75.3 80.9 78.9<br />
Group balance sheet<br />
Non-current assets 9,461.7 7,077.0 4,372.8 3,524.0 3,689.8<br />
Net current (liabilities)/assets (360.2) (150.2) 139.9 (215.4) (134.8)<br />
Total assets less current liabilities 9,101.5 6,926.8 4,512.7 3,308.6 3,555.0<br />
Long-term liabilities (4,335.5) (3,023.4) (2,064.2) (1,414.7) (2,131.7)<br />
Net assets 4,766.0 3,903.4 2,448.5 1,893.9 1,423.3<br />
Called up equity share capital 146.2 143.5 130.1 119.7 117.4<br />
Share premium 551.8 251.5 242.3 231.1 178.0<br />
Other reserves 551.1 574.2 614.5 607.8 541.9<br />
Retained earnings 3,441.3 2,873.6 1,419.5 898.6 555.0<br />
Equity attributable to equity holders of the parent 4,690.4 3,842.8 2,406.4 1,857.2 1,392.3<br />
Non-controlling interest 75.6 60.6 42.1 36.7 31.0<br />
Total equity 4,766.0 3,903.4 2,448.5 1,893.9 1,423.3<br />
* The 2007 comparatives have been restated due to an asset held for sale being reclassified during 2008. The 2009 and 2010 comparatives have been restated due to a<br />
change in the inventory accounting policy.<br />
168<br />
<strong>Tullow</strong> <strong>Oil</strong> <strong>plc</strong> <strong>2011</strong> <strong>Annual</strong> <strong>Report</strong> and Accounts