2011 Annual Report PDF - Tullow Oil plc
2011 Annual Report PDF - Tullow Oil plc
2011 Annual Report PDF - Tullow Oil plc

Create successful ePaper yourself
Turn your PDF publications into a flip-book with our unique Google optimized e-Paper software.
Notes to the Group financial statements continued<br />
Year ended 31 December <strong>2011</strong><br />
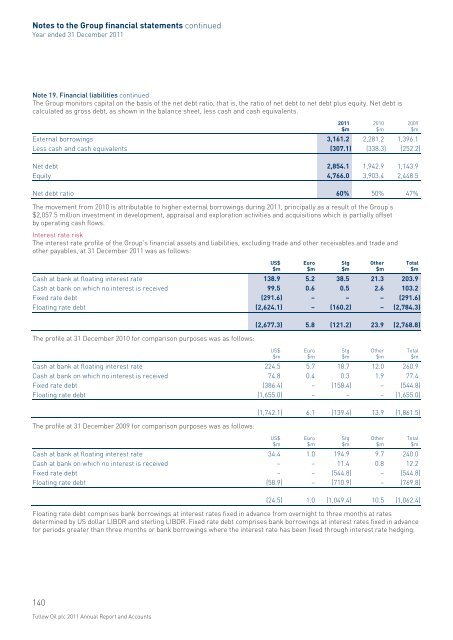
Note 19. Financial liabilities continued<br />
The Group monitors capital on the basis of the net debt ratio, that is, the ratio of net debt to net debt plus equity. Net debt is<br />
calculated as gross debt, as shown in the balance sheet, less cash and cash equivalents.<br />
External borrowings 3,161.2 2,281.2 1,396.1<br />
Less cash and cash equivalents (307.1) (338.3) (252.2)<br />
<strong>2011</strong><br />
$m<br />
2010<br />
$m<br />
2009<br />
$m<br />
Net debt 2,854.1 1,942.9 1,143.9<br />
Equity 4,766.0 3,903.4 2,448.5<br />
Net debt ratio 60% 50% 47%<br />
The movement from 2010 is attributable to higher external borrowings during <strong>2011</strong>, principally as a result of the Group’s<br />
$2,057.5 million investment in development, appraisal and exploration activities and acquisitions which is partially offset<br />
by operating cash flows.<br />
Interest rate risk<br />
The interest rate profile of the Group’s financial assets and liabilities, excluding trade and other receivables and trade and<br />
other payables, at 31 December <strong>2011</strong> was as follows:<br />
Cash at bank at floating interest rate 138.9 5.2 38.5 21.3 203.9<br />
Cash at bank on which no interest is received 99.5 0.6 0.5 2.6 103.2<br />
Fixed rate debt (291.6) – – – (291.6)<br />
Floating rate debt (2,624.1) – (160.2) – (2,784.3)<br />
US$<br />
$m<br />
Euro<br />
$m<br />
Stg<br />
$m<br />
Other<br />
$m<br />
Total<br />
$m<br />
The profile at 31 December 2010 for comparison purposes was as follows:<br />
(2,677.3) 5.8 (121.2) 23.9 (2,768.8)<br />
Cash at bank at floating interest rate 224.5 5.7 18.7 12.0 260.9<br />
Cash at bank on which no interest is received 74.8 0.4 0.3 1.9 77.4<br />
Fixed rate debt (386.4) – (158.4) – (544.8)<br />
Floating rate debt (1,655.0) – – – (1,655.0)<br />
US$<br />
$m<br />
Euro<br />
$m<br />
Stg<br />
$m<br />
Other<br />
$m<br />
Total<br />
$m<br />
The profile at 31 December 2009 for comparison purposes was as follows:<br />
(1,742.1) 6.1 (139.4) 13.9 (1,861.5)<br />
Cash at bank at floating interest rate 34.4 1.0 194.9 9.7 240.0<br />
Cash at bank on which no interest is received – – 11.4 0.8 12.2<br />
Fixed rate debt – – (544.8) – (544.8)<br />
Floating rate debt (58.9) – (710.9) – (769.8)<br />
US$<br />
$m<br />
Euro<br />
$m<br />
Stg<br />
$m<br />
Other<br />
$m<br />
Total<br />
$m<br />
(24.5) 1.0 (1,049.4) 10.5 (1,062.4)<br />
Floating rate debt comprises bank borrowings at interest rates fixed in advance from overnight to three months at rates<br />
determined by US dollar LIBOR and sterling LIBOR. Fixed rate debt comprises bank borrowings at interest rates fixed in advance<br />
for periods greater than three months or bank borrowings where the interest rate has been fixed through interest rate hedging.<br />
140<br />
<strong>Tullow</strong> <strong>Oil</strong> <strong>plc</strong> <strong>2011</strong> <strong>Annual</strong> <strong>Report</strong> and Accounts