

bank-r-and-a
bank-r-and-a
bank-r-and-a

You also want an ePaper? Increase the reach of your titles
YUMPU automatically turns print PDFs into web optimized ePapers that Google loves.
Overview Strategic report Corporate governance Risk management Financial statements Other information<br />
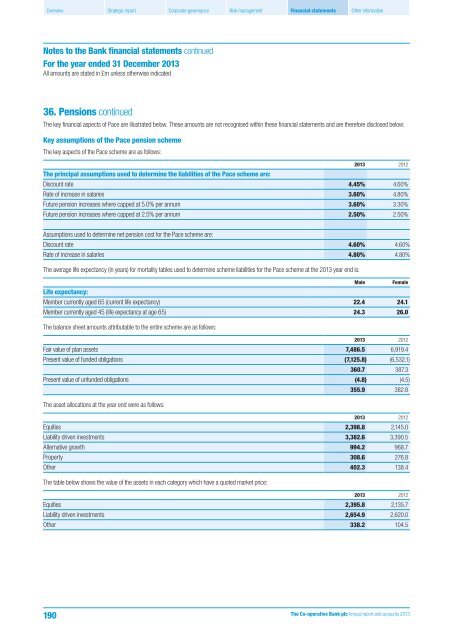
Notes to the Bank financial statements continued<br />
For the year ended 31 December 2013<br />
All amounts are stated in £m unless otherwise indicated<br />
36. Pensions continued<br />
The key financial aspects of Pace are illustrated below. These amounts are not recognised within these financial statements <strong>and</strong> are therefore disclosed below:<br />
Key assumptions of the Pace pension scheme<br />
The key aspects of the Pace scheme are as follows:<br />
2013 2012<br />
The principal assumptions used to determine the liabilities of the Pace scheme are:<br />
Discount rate 4.45% 4.60%<br />
Rate of increase in salaries 3.60% 4.80%<br />
Future pension increases where capped at 5.0% per annum 3.60% 3.30%<br />
Future pension increases where capped at 2.5% per annum 2.50% 2.50%<br />
Assumptions used to determine net pension cost for the Pace scheme are:<br />
Discount rate 4.60% 4.60%<br />
Rate of increase in salaries 4.80% 4.80%<br />
The average life expectancy (in years) for mortality tables used to determine scheme liabilities for the Pace scheme at the 2013 year end is:<br />
Male<br />
Female<br />
Life expectancy:<br />
Member currently aged 65 (current life expectancy) 22.4 24.1<br />
Member currently aged 45 (life expectancy at age 65) 24.3 26.0<br />
The balance sheet amounts attributable to the entire scheme are as follows:<br />
2013 2012<br />
Fair value of plan assets 7,486.5 6,919.4<br />
Present value of funded obligations (7,125.8) (6,532.1)<br />
360.7 387.3<br />
Present value of unfunded obligations (4.8) (4.5)<br />
355.9 382.8<br />
The asset allocations at the year end were as follows:<br />
2013 2012<br />
Equities 2,398.8 2,145.0<br />
Liability driven investments 3,382.6 3,390.5<br />
Alternative growth 994.2 968.7<br />
Property 308.6 276.8<br />
Other 402.3 138.4<br />
The table below shows the value of the assets in each category which have a quoted market price:<br />
2013 2012<br />
Equities 2,395.8 2,135.7<br />
Liability driven investments 2,654.9 2,620.0<br />
Other 338.2 104.5<br />
190<br />
The Co-operative Bank plc Annual report <strong>and</strong> accounts 2013