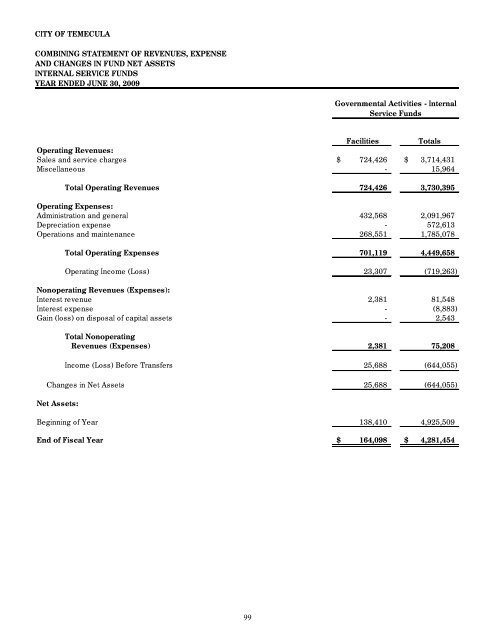
CITY OF TEMECULA COMBINING STATEMENT OF REVENUES, EXPENSE AND CHANGES IN FUND NET ASSETS INTERNAL SERVICE FUNDS YEAR ENDED JUNE 30, 2009 Governmental Activities - Internal Service Funds Operating Revenues: Sales and service charges Miscellaneous Total Operating Revenues Operating Expenses: Administration and general Depreciation expense Operations and maintenance Total Operating Expenses Operating Income (Loss) Nonoperating Revenues (Expenses): Interest revenue Interest expense Gain (loss) on disposal <strong>of</strong> capital assets Total Nonoperating Revenues (Expenses) Income (Loss) Before Transfers Changes in Net Assets Facilities Totals $ 724,426 $ 3,714,431 - 15,964 724,426 3,730,395 432,568 2,091,967 - 572,613 268,551 1,785,078 701,119 4,449,658 23,307 (719,263) 2,381 81,548 - (8,883) - 2,543 2,381 75,208 25,688 (644,055) 25,688 (644,055) Net Assets: Beginning <strong>of</strong> Year End <strong>of</strong> Fiscal Year 138,410 4,925,509 $ 164,098 $ 4,281,454 99
CITY OF TEMECULA COMBINING STATEMENT OF CASH FLOWS INTERNAL SERVICE FUNDS YEAR ENDED JUNE 30, 2009 Governmental Activities - Internal Service Funds Information Support Insurance Vehicles Systems Services Cash Flows from Operating Activities: Cash received from customers and users $ 287,911 $ 330,592 $ 2,103,905 $ 277,914 Cash paid to suppliers for goods and services (698,871) 145,573 (783,554) (64,228) Cash paid to employees for services (63,916) - (1,344,678) (196,466) Net Cash Provided (Used) by Operating Activities (474,876) 476,165 (24,327) 17,220 Cash Flows from Capital and Related Financing Activities: Acquisition and construction <strong>of</strong> capital assets - (278,835) (159,153) - Principal payments on capital lease - - - (41,875) Interest paid on capital debt - - - (8,883) Proceeds from sales <strong>of</strong> capital assets - 2,543 - - Net Cash Provided (Used) by Capital and Related Financing Activities - (276,292) (159,153) (50,758) Cash Flows from Investing Activities: Interest received 44,732 22,394 17,479 10,060 Net Cash Provided (Used) by Investing Activities 44,870 22,394 17,479 10,060 Net Increase (Decrease) in Cash and Cash Equivalents (430,006) 222,267 (166,001) (23,478) Cash and Cash Equivalents at Beginning <strong>of</strong> Year 1,507,401 701,638 943,025 373,369 Cash and Cash Equivalents at End <strong>of</strong> Year $ 1,077,395 $ 923,905 $ 777,024 $ 349,891 Reconciliation <strong>of</strong> Operating Income to Net Cash Provided (Used) by Operating Activities: Operating income (loss) $ (414,330) $ 16,077 $ (330,120) $ (14,197) Adjustments to reconcile operating income (loss) net cash provided (used) by operating activities: Depreciation - 314,515 227,712 30,386 (Increase) decrease in accounts receivable 859 - 1,148 (3,503) (Increase) decrease in prepaid expense 265 - - 1,199 Increase (decrease) in accounts payable 30,074 145,573 22,365 (2,072) Increase (decrease) in accrued liabilities (2,089) - 28,768 2,248 Increase (decrease) in deferred/unearned revenue - - (4,151) - Increase (decrease) in claims and judgments (81,957) - - - Increase (decrease) in compensated absences (7,698) - 29,951 3,159 Total Adjustments (60,546) 460,088 305,793 31,417 Net Cash Provided (Used) by Operating Activities $ (474,876) $ 476,165 $ (24,327) $ 17,220 Non-Cash Investing, Capital, and Financing Activities: There were no noncash investing, capital or financing activities 100