California Comprehensive Annual Financial Report - City of Temecula
California Comprehensive Annual Financial Report - City of Temecula
California Comprehensive Annual Financial Report - City of Temecula

You also want an ePaper? Increase the reach of your titles
YUMPU automatically turns print PDFs into web optimized ePapers that Google loves.
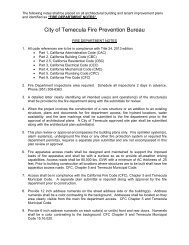
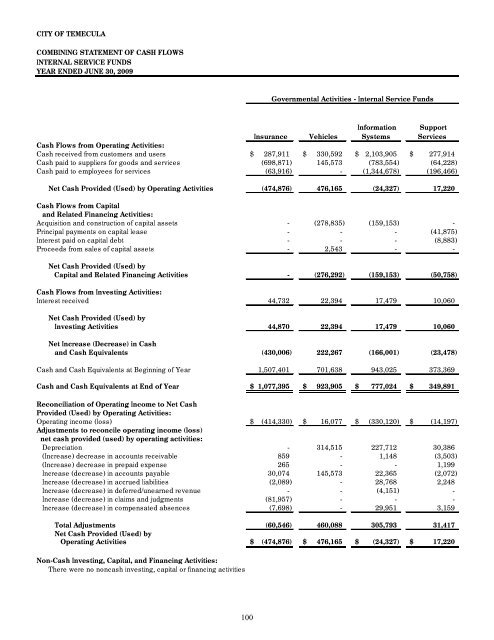
CITY OF TEMECULA<br />
COMBINING STATEMENT OF CASH FLOWS<br />
INTERNAL SERVICE FUNDS<br />
YEAR ENDED JUNE 30, 2009<br />
Governmental Activities - Internal Service Funds<br />
Information Support<br />
Insurance Vehicles Systems Services<br />
Cash Flows from Operating Activities:<br />
Cash received from customers and users $ 287,911 $ 330,592 $ 2,103,905 $ 277,914<br />
Cash paid to suppliers for goods and services (698,871) 145,573 (783,554) (64,228)<br />
Cash paid to employees for services (63,916) - (1,344,678) (196,466)<br />
Net Cash Provided (Used) by Operating Activities (474,876) 476,165 (24,327) 17,220<br />
Cash Flows from Capital<br />
and Related Financing Activities:<br />
Acquisition and construction <strong>of</strong> capital assets - (278,835) (159,153) -<br />
Principal payments on capital lease - - - (41,875)<br />
Interest paid on capital debt - - - (8,883)<br />
Proceeds from sales <strong>of</strong> capital assets - 2,543 - -<br />
Net Cash Provided (Used) by<br />
Capital and Related Financing Activities - (276,292) (159,153) (50,758)<br />
Cash Flows from Investing Activities:<br />
Interest received 44,732 22,394 17,479 10,060<br />
Net Cash Provided (Used) by<br />
Investing Activities 44,870 22,394 17,479 10,060<br />
Net Increase (Decrease) in Cash<br />
and Cash Equivalents (430,006) 222,267 (166,001) (23,478)<br />
Cash and Cash Equivalents at Beginning <strong>of</strong> Year 1,507,401 701,638 943,025 373,369<br />
Cash and Cash Equivalents at End <strong>of</strong> Year $ 1,077,395 $ 923,905 $ 777,024 $ 349,891<br />
Reconciliation <strong>of</strong> Operating Income to Net Cash<br />
Provided (Used) by Operating Activities:<br />
Operating income (loss) $ (414,330) $ 16,077 $ (330,120) $ (14,197)<br />
Adjustments to reconcile operating income (loss)<br />
net cash provided (used) by operating activities:<br />
Depreciation - 314,515 227,712 30,386<br />
(Increase) decrease in accounts receivable 859 - 1,148 (3,503)<br />
(Increase) decrease in prepaid expense 265 - - 1,199<br />
Increase (decrease) in accounts payable 30,074 145,573 22,365 (2,072)<br />
Increase (decrease) in accrued liabilities (2,089) - 28,768 2,248<br />
Increase (decrease) in deferred/unearned revenue - - (4,151) -<br />
Increase (decrease) in claims and judgments (81,957) - - -<br />
Increase (decrease) in compensated absences (7,698) - 29,951 3,159<br />
Total Adjustments (60,546) 460,088 305,793 31,417<br />
Net Cash Provided (Used) by<br />
Operating Activities $ (474,876) $ 476,165 $ (24,327) $ 17,220<br />
Non-Cash Investing, Capital, and Financing Activities:<br />
There were no noncash investing, capital or financing activities<br />
100