California Comprehensive Annual Financial Report - City of Temecula
California Comprehensive Annual Financial Report - City of Temecula
California Comprehensive Annual Financial Report - City of Temecula

You also want an ePaper? Increase the reach of your titles
YUMPU automatically turns print PDFs into web optimized ePapers that Google loves.
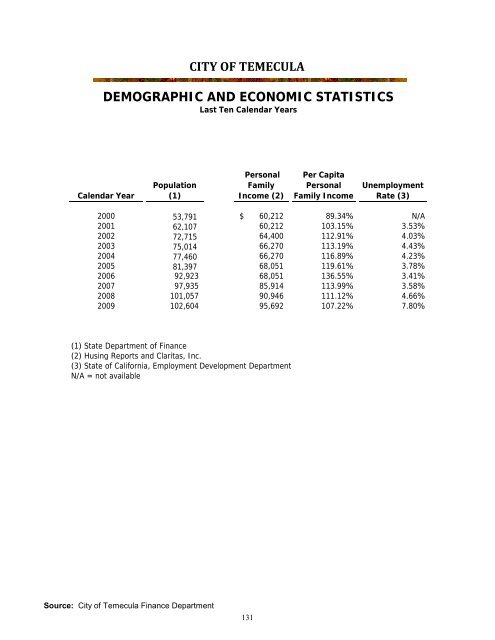
CITY OF TEMECULA<br />
DEMOGRAPHIC AND ECONOMIC STATISTICS<br />
Last Ten Calendar Years<br />
Calendar Year<br />
Population<br />
(1)<br />
Personal<br />
Family<br />
Income (2)<br />
Per Capita<br />
Personal<br />
Family Income<br />
Unemployment<br />
Rate (3)<br />
2000 53,791 $ 60,212<br />
89.34% N/A<br />
2001 62,107 60,212 103.15% 3.53%<br />
2002 72,715 64,400 112.91% 4.03%<br />
2003 75,014 66,270 113.19% 4.43%<br />
2004 77,460 66,270 116.89% 4.23%<br />
2005 81,397 68,051 119.61% 3.78%<br />
2006 92,923 68,051 136.55% 3.41%<br />
2007 97,935 85,914 113.99% 3.58%<br />
2008 101,057 90,946 111.12% 4.66%<br />
2009 102,604 95,692 107.22% 7.80%<br />
(1) State Department <strong>of</strong> Finance<br />
(2) Husing <strong>Report</strong>s and Claritas, Inc.<br />
(3) State <strong>of</strong> <strong>California</strong>, Employment Development Department<br />
N/A = not available<br />
Source: <strong>City</strong> <strong>of</strong> <strong>Temecula</strong> Finance Department<br />
131