California Comprehensive Annual Financial Report - City of Temecula
California Comprehensive Annual Financial Report - City of Temecula
California Comprehensive Annual Financial Report - City of Temecula

Create successful ePaper yourself
Turn your PDF publications into a flip-book with our unique Google optimized e-Paper software.
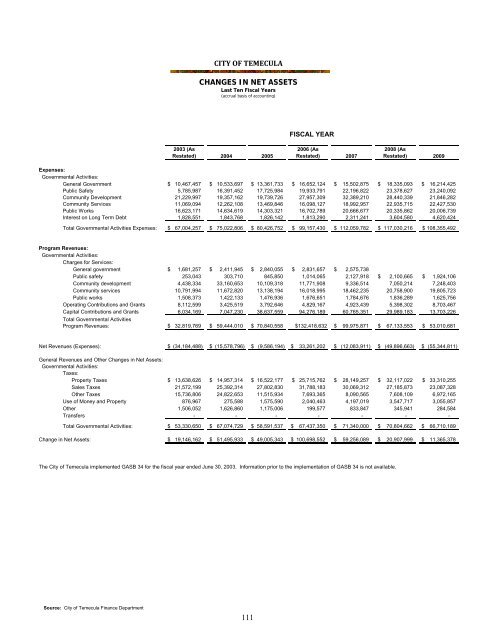
CITY OF TEMECULA<br />
CHANGES IN NET ASSETS<br />
Last Ten Fiscal Years<br />
(accrual basis <strong>of</strong> accounting)<br />
FISCAL YEAR<br />
2003 (As<br />
Restated) 2004 2005<br />
2006 (As<br />
Restated) 2007<br />
2008 (As<br />
Restated) 2009<br />
Expenses:<br />
Governmental Activities:<br />
General Government $ 10,467,457 $ 10,533,697 $ 13,361,733 $ 16,652,124 $ 15,502,875 $ 18,335,093 $ 16,214,425<br />
Public Safety 5,785,987 16,391,452 17,725,984 19,933,791 22,196,822 23,378,627 23,240,092<br />
Community Development 21,229,997 19,357,162 19,739,726 27,957,309 32,389,210 28,440,339 21,846,282<br />
Community Services<br />
11,069,094 12,262,108 13,469,846 16,098,127 18,992,957 22,935,715 22,427,530<br />
Public Works 16,623,171 14,634,619 14,303,321 16,702,789 20,666,677 20,335,862 20,006,739<br />
Interest on Long Term Debt 1,828,551 1,843,768 1,826,142 1,813,290 2,311,241 3,604,580 4,620,424<br />
Total Governmental Activities Expenses: $ 67,004,257 $ 75,022,806 $ 80,426,752 $ 99,157,430 $ 112,059,782 $ 117,030,216 $ 108,355,492<br />
Program Revenues:<br />
Governmental Activities:<br />
Charges for Services:<br />
General government $ 1,681,257 $ 2,411,945 $ 2,840,055 $ 2,831,657 $ 2,575,738<br />
Public safety 253,043 303,710 845,850 1,014,065 2,127,918 $ 2,100,665 $ 1,924,106<br />
Community development 4,438,334 33,160,653 10,109,318 11,771,908 9,336,514 7,050,214 7,248,403<br />
Community services 10,791,994 11,672,820 13,138,194 16,018,995 18,462,235 20,758,900 19,805,723<br />
Public works 1,508,373 1,422,133 1,476,936 1,676,651 1,784,676 1,836,289 1,625,756<br />
Operating Contributions and Grants<br />
Capital Contributions and Grants<br />
Total Governmental Activities<br />
Program Revenues:<br />
8,112,599 3,425,519 3,792,646 4,829,167 4,923,439 5,398,302 8,703,467<br />
6,034,169 7,047,230 38,637,559 94,276,189 60,765,351 29,989,183 13,703,226<br />
$ 32,819,769 $ 59,444,010 $ 70,840,558 $132,418,632 $ 99,975,871 $ 67,133,553 $ 53,010,681<br />
Net Revenues (Expenses): $ (34,184,488) $ (15,578,796) $ (9,586,194) $ 33,261,202 $ (12,083,911) $ (49,896,663) $ (55,344,811)<br />
General Revenues and Other Changes in Net Assets:<br />
Governmental Activities:<br />
Taxes:<br />
Property Taxes $ 13,638,626 $ 14,957,314 $ 16,522,177 $ 25,715,762 $ 28,149,257 $ 32,117,022 $ 33,310,255<br />
Sales Taxes 21,572,199 25,392,314 27,802,830 31,788,183 30,069,312 27,185,873 23,087,328<br />
Other Taxes 15,736,806 24,822,653 11,515,934 7,693,365 8,090,565 7,608,109 6,972,165<br />
Use <strong>of</strong> Money and Property 876,967 275,588 1,575,590 2,040,463 4,197,019 3,547,717 3,055,857<br />
Other 1,506,052 1,626,860 1,175,006 199,577 833,847 345,941 284,584<br />
Transfers - - - - - - -<br />
Total Governmental Activities: $ 53,330,650 $ 67,074,729 $ 58,591,537 $ 67,437,350 $ 71,340,000 $ 70,804,662 $ 66,710,189<br />
Change in Net Assets: $ 19,146,162 $ 51,495,933 $ 49,005,343 $ 100,698,552 $ 59,256,089 $ 20,907,999 $ 11,365,378<br />
The <strong>City</strong> <strong>of</strong> <strong>Temecula</strong> implemented GASB 34 for the fiscal year ended June 30, 2003. Information prior to the implementation <strong>of</strong> GASB 34 is not available.<br />
Source: <strong>City</strong> <strong>of</strong> <strong>Temecula</strong> Finance Department<br />
111