California Comprehensive Annual Financial Report - City of Temecula
California Comprehensive Annual Financial Report - City of Temecula
California Comprehensive Annual Financial Report - City of Temecula

Create successful ePaper yourself
Turn your PDF publications into a flip-book with our unique Google optimized e-Paper software.
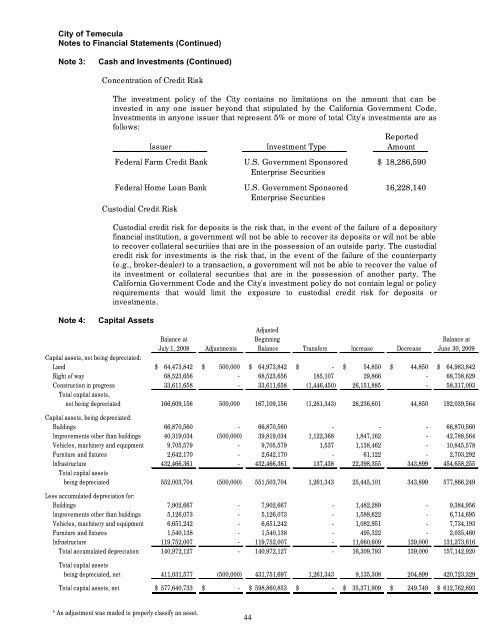
<strong>City</strong> <strong>of</strong> <strong>Temecula</strong><br />
Notes to <strong>Financial</strong> Statements (Continued)<br />
Note 3:<br />
Cash and Investments (Continued)<br />
Concentration <strong>of</strong> Credit Risk<br />
The investment policy <strong>of</strong> the <strong>City</strong> contains no limitations on the amount that can be<br />
invested in any one issuer beyond that stipulated by the <strong>California</strong> Government Code.<br />
Investments in anyone issuer that represent 5% or more <strong>of</strong> total <strong>City</strong>'s investments are as<br />
follows:<br />
<strong>Report</strong>ed<br />
Issuer Investment Type Amount<br />
Federal Farm Credit Bank U.S. Government Sponsored $ 18,286,590<br />
Enterprise Securities<br />
Federal Home Loan Bank U.S. Government Sponsored 16,228,140<br />
Enterprise Securities<br />
Custodial Credit Risk<br />
Custodial credit risk for deposits is the risk that, in the event <strong>of</strong> the failure <strong>of</strong> a depository<br />
financial institution, a government will not be able to recover its deposits or will not be able<br />
to recover collateral securities that are in the possession <strong>of</strong> an outside party. The custodial<br />
credit risk for investments is the risk that, in the event <strong>of</strong> the failure <strong>of</strong> the counterparty<br />
(e.g., broker-dealer) to a transaction, a government will not be able to recover the value <strong>of</strong><br />
its investment or collateral securities that are in the possession <strong>of</strong> another party. The<br />
<strong>California</strong> Government Code and the <strong>City</strong>'s investment policy do not contain legal or policy<br />
requirements that would limit the exposure to custodial credit risk for deposits or<br />
investments.<br />
Note 4: Capital Assets<br />
Adjusted<br />
Balance at Beginning Balance at<br />
July 1, 2008 Adjustments Balance Transfers Increase Decrease June 30, 2009<br />
Capital assets, not being depreciated:<br />
Land $ 64,473,842 $ 500,000 $ 64,973,842 $ - $ 54,850 $ 44,850 $ 64,983,842<br />
Right <strong>of</strong> way 68,523,656 - 68,523,656 185,107 29,866 - 68,738,629<br />
Construction in progress 33,611,658 - 33,611,658 (1,446,450) 26,151,885 - 58,317,093<br />
Total capital assets,<br />
not being depreciated 166,609,156 500,000 167,109,156 (1,261,343) 26,236,601 44,850 192,039,564<br />
Capital assets, being depreciated:<br />
Buildings 66,870,560 - 66,870,560 - - - 66,870,560<br />
Improvements other than buildings 40,319,034 (500,000) 39,819,034 1,122,368 1,847,162 - 42,788,564<br />
Vehicles, machinery and equipment 9,705,579 - 9,705,579 1,537 1,138,462 - 10,845,578<br />
Furniture and fixtures 2,642,170 - 2,642,170 - 61,122 - 2,703,292<br />
Infrastructure 432,466,361 - 432,466,361 137,438 22,398,355 343,899 454,658,255<br />
Total capital assets<br />
being depreciated 552,003,704 (500,000) 551,503,704 1,261,343 25,445,101 343,899 577,866,249<br />
Less accumulated depreciation for:<br />
Buildings 7,902,667 - 7,902,667 - 1,482,289 - 9,384,956<br />
Improvements other than buildings 5,126,073 - 5,126,073 - 1,588,622 - 6,714,695<br />
Vehicles, machinery and equipment 6,651,242 - 6,651,242 - 1,082,951 - 7,734,193<br />
Furniture and fixtures 1,540,138 - 1,540,138 - 495,322 - 2,035,460<br />
Infrastructure 119,752,007 - 119,752,007 - 11,660,609 139,000 131,273,616<br />
Total accumulated depreciation 140,972,127 - 140,972,127 - 16,309,793 139,000 157,142,920<br />
Total capital assets<br />
being depreciated, net 411,031,577 (500,000) 431,751,697 1,261,343 9,135,308 204,899 420,723,329<br />
Total capital assets, net $ 577,640,733 $ - $ 598,860,853 $ - $ 35,371,909 $ 249,749 $ 612,762,893<br />
* An adjustment was maded to properly classify an asset.<br />
44