4 - Central Institute of Brackishwater Aquaculture
4 - Central Institute of Brackishwater Aquaculture
4 - Central Institute of Brackishwater Aquaculture

You also want an ePaper? Increase the reach of your titles
YUMPU automatically turns print PDFs into web optimized ePapers that Google loves.
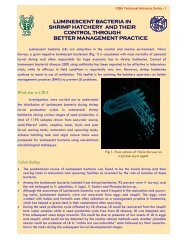
Natlonal Workshop-cum-Training on Bloinformaticr and Information Management in <strong>Aquaculture</strong><br />
where Zs are 25 farm-specific variables (table 1 & 2) and 6s are unknown<br />
parameters to be estimated. Since the dependent variable in (2) is defined in<br />
terms <strong>of</strong> technical inefficiency, a farm-specific variable associated with a negative<br />
coefficient will have a positive impact on technical efficiency (Sharma and Leung,<br />
2000a)<br />
Socio economic and demographic variables (table 1) are expected to have some<br />
impact on technical efficiency. Similarly farm specific variables (table 1) are also<br />
expected to have an impact over technical efficiency affecting carp yield. Farm<br />
specific technical efficiency <strong>of</strong> the i-th sample farm (TE,) is obtained using the<br />
relationship.<br />
Antilog and expected value TE, = exp (-U,) and E(-U,) ................................... (3)<br />
The prediction <strong>of</strong> technical efficiencies is based on the conditional expectation <strong>of</strong><br />
expression in (3) given the model which specifications (Battese and Coelli,<br />
1988). The parameters for the stochastic production frontier model in (1) and<br />
those for the technical inefficiency model in (2) were estimated simultaneously<br />
with maximum-likelihood estimation (MLE) using an econometric computer<br />
program, FRONTIER 4.1 (Coelli, 1994), that estimates the variance <strong>of</strong> the<br />
likelihood function as o2 = oU2+av2 and r = oU2/o2<br />
o2 and r are not respondent estimates r=1-nu2/o2<br />
Hypothesis test:<br />
The following hypotheses were tested with a generalized likelihood ratio test to<br />
ensure that inefficiency effects were absent from the model.<br />
Ho: p = 0, the null hypothesis specifies that a simpler half normal<br />
distribution is an adequate distribution <strong>of</strong> data.<br />
Ho: :/ = 60 = 61 = ...... = 62, = 0, technical inefficiency does not exist.<br />
Ho: y = 0, technical inefficiency is deterministic. Hence explanatory<br />
variables in (2) must be included in along with input and other relevant<br />
variables.<br />
Ho: 61 = S2 = ...... = =0, technical inefficiency effects follows a standard<br />
truncated-normal distribution with no technical inefficiency effects.<br />
The null hypothesis can be tested using the generalized likelihood -ratio<br />
statistic, h, given by:<br />
I = -2 [Ln {L (Ho)) - Ln {L (H,))] ................... .( 4)<br />
where L (Ho) and L (HI) denote the values <strong>of</strong> likelihood function under the null<br />
(Ho) and alternative (HI) hypotheses respectively. If the given null hypothesis is<br />
true, I has approximately X2 distribution or mixed x2 distribution under y = 0<br />
(Coelli, 1995).<br />
4. Results<br />
4.1. Maximum livelihood estimates and test <strong>of</strong> hypotheses<br />
The hypothesis that technical inefficiency effects have a half-normal distribution<br />
with mean zero was rejected. Likewise the hypothesis that there is no technical<br />
inefficiency was also rejected. The hypothesis that technical inefficiency is<br />
deterministic is rejected. The null hypothesis that all the parameters in the<br />
technical inefficiency model except the constant term are zero i.e., the technical