2011 Annual report - touax group
2011 Annual report - touax group
2011 Annual report - touax group

You also want an ePaper? Increase the reach of your titles
YUMPU automatically turns print PDFs into web optimized ePapers that Google loves.
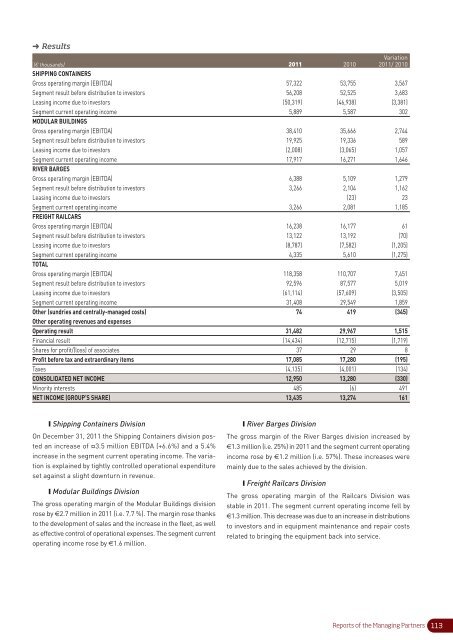
➜ Results<br />
Variation<br />
(€ thousands) <strong>2011</strong> 2010 <strong>2011</strong>/ 2010<br />
SHIPPING CONTAINERS<br />
Gross operating margin (EBITDA) 57,322 53,755 3,567<br />
Segment result before distribution to investors 56,208 52,525 3,683<br />
Leasing income due to investors (50,319) (46,938) (3,381)<br />
Segment current operating income 5,889 5,587 302<br />
MODULAR BUILDINGS<br />
Gross operating margin (EBITDA) 38,410 35,666 2,744<br />
Segment result before distribution to investors 19,925 19,336 589<br />
Leasing income due to investors (2,008) (3,065) 1,057<br />
Segment current operating income 17,917 16,271 1,646<br />
RIVER BARGES<br />
Gross operating margin (EBITDA) 6,388 5,109 1,279<br />
Segment result before distribution to investors 3,266 2,104 1,162<br />
Leasing income due to investors (23) 23<br />
Segment current operating income 3,266 2,081 1,185<br />
FREIGHT RAILCARS<br />
Gross operating margin (EBITDA) 16,238 16,177 61<br />
Segment result before distribution to investors 13,122 13,192 (70)<br />
Leasing income due to investors (8,787) (7,582) (1,205)<br />
Segment current operating income 4,335 5,610 (1,275)<br />
TOTAL<br />
Gross operating margin (EBITDA) 118,358 110,707 7,451<br />
Segment result before distribution to investors 92,596 87,577 5,019<br />
Leasing income due to investors (61,114) (57,609) (3,505)<br />
Segment current operating income 31,408 29,549 1,859<br />
Other (sundries and centrally-managed costs) 74 419 (345)<br />
Other operating revenues and expenses<br />
Operating result 31,482 29,967 1,515<br />
Financial result (14,434) (12,715) (1,719)<br />
Shares for profit/(loss) of associates 37 29 8<br />
Profit before tax and extraordinary items 17,085 17,280 (195)<br />
Taxes (4,135) (4,001) (134)<br />
CONSOLIDATED NET INCOME 12,950 13,280 (330)<br />
Minority interests 485 (6) 491<br />
NET INCOME (GROUP’S SHARE) 13,435 13,274 161<br />
❙ Shipping Containers Division<br />
On December 31, <strong>2011</strong> the Shipping Containers division posted<br />
an increase of ¤3.5 million EBITDA (+6.6%) and a 5.4%<br />
increase in the segment current operating income. The variation<br />
is explained by tightly controlled operational expenditure<br />
set against a slight downturn in revenue.<br />
❙ Modular Buildings Division<br />
The gross operating margin of the Modular Buildings division<br />
rose by €2.7 million in <strong>2011</strong> (i.e. 7.7 %). The margin rose thanks<br />
to the development of sales and the increase in the fleet, as well<br />
as effective control of operational expenses. The segment current<br />
operating income rose by €1.6 million.<br />
❙ River Barges Division<br />
The gross margin of the River Barges division increased by<br />
€1.3 million (i.e. 25%) in <strong>2011</strong> and the segment current operating<br />
income rose by €1.2 million (i.e. 57%). These increases were<br />
mainly due to the sales achieved by the division.<br />
❙ Freight Railcars Division<br />
The gross operating margin of the Railcars Division was<br />
stable in <strong>2011</strong>. The segment current operating income fell by<br />
€1.3 million. This decrease was due to an increase in distributions<br />
to investors and in equipment maintenance and repair costs<br />
related to bringing the equipment back into service.<br />
Reports of the Managing Partners<br />
113