2011 Annual report - touax group
2011 Annual report - touax group
2011 Annual report - touax group
You also want an ePaper? Increase the reach of your titles
YUMPU automatically turns print PDFs into web optimized ePapers that Google loves.
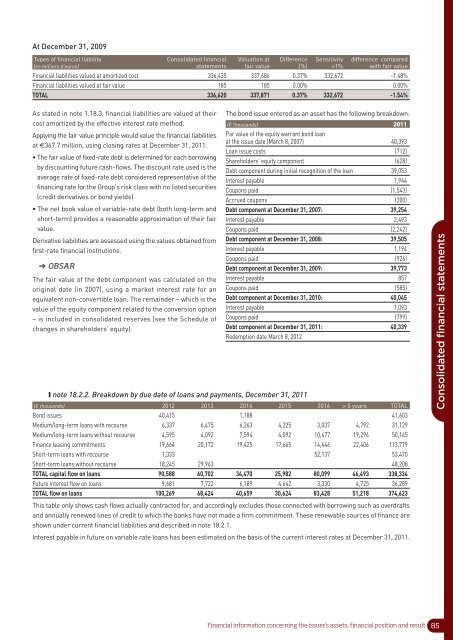
At December 31, 2009<br />
Types of financial liability Consolidated financial Valuation at Difference Sensitivity difference compared<br />
(en milliers d’euros) statements fair value (%) +1% with fair value<br />
Financial liabilities valued at amortized cost 336,435 337,686 0.37% 332,672 -1.48%<br />
Financial liabilities valued at fair value 185 185 0.00% 0.00%<br />
TOTAL 336,620 337,871 0.37% 332,672 -1.54%<br />
As stated in note 1.18.3, financial liabilities are valued at their<br />
cost amortized by the effective interest rate method.<br />
Applying the fair value principle would value the financial liabilities<br />
at €367.7 million, using closing rates at December 31, <strong>2011</strong>.<br />
• The fair value of fixed-rate debt is determined for each borrowing<br />
by discounting future cash-flows. The discount rate used is the<br />
average rate of fixed-rate debt considered representative of the<br />
financing rate for the Group's risk class with no listed securities<br />
(credit derivatives or bond yields).<br />
• The net book value of variable-rate debt (both long-term and<br />
short-term) provides a reasonable approximation of their fair<br />
value.<br />
Derivative liabilities are assessed using the values obtained from<br />
first-rate financial institutions.<br />
➜ OBSAR<br />
The fair value of the debt component was calculated on the<br />
original date (in 2007), using a market interest rate for an<br />
equivalent non-convertible loan. The remainder – which is the<br />
value of the equity component related to the conversion option<br />
– is included in consolidated reserves (see the Schedule of<br />
changes in shareholders’ equity).<br />
❙ note 18.2.2. Breakdown by due date of loans and payments, December 31, <strong>2011</strong><br />
The bond issue entered as an asset has the following breakdown:<br />
(€ thousands) <strong>2011</strong><br />
Par value of the equity warrant bond loan<br />
at the issue date (March 8, 2007) 40,393<br />
Loan issue costs (712)<br />
Shareholders' equity component (628)<br />
Debt component during initial recognition of the loan 39,053<br />
Interest payable 1,944<br />
Coupons paid (1,543)<br />
Accrued coupons (200)<br />
Debt component at December 31, 2007: 39,254<br />
Interest payable 2,493<br />
Coupons paid (2,242)<br />
Debt component at December 31, 2008: 39,505<br />
Interest payable 1,194<br />
Coupons paid (926)<br />
Debt component at December 31, 2009: 39,773<br />
Interest payable 857<br />
Coupons paid (585)<br />
Debt component at December 31, 2010: 40,045<br />
Interest payable 1,093<br />
Coupons paid (799)<br />
Debt component at December 31, <strong>2011</strong>: 40,339<br />
Redemption date March 8, 2012<br />
(€ thousands) 2012 2013 2014 2015 2016 > 5 years TOTAL<br />
Bond issues 40,415 1,188 41,603<br />
Medium/long-term loans with recourse 6,337 6,475 6,263 4,225 3,037 4,792 31,129<br />
Medium/long-term loans without recourse 4,595 4,092 7,594 4,092 10,477 19,294 50,145<br />
Finance leasing commitments 19,664 20,172 19,425 17,665 14,446 22,406 113,779<br />
Short-term loans with recourse 1,333 52,137 53,470<br />
Short-term loans without recourse 18,245 29,963 48,208<br />
TOTAL capital flow on loans 90,588 60,702 34,470 25,982 80,099 46,493 338,334<br />
Future interest flow on loans 9,681 7,722 6,189 4,642 3,330 4,725 36,289<br />
TOTAL flow on loans 100,269 68,424 40,659 30,624 83,428 51,218 374,623<br />
Consolidated financial statements<br />
This table only shows cash flows actually contracted for, and accordingly excludes those connected with borrowing such as overdrafts<br />
and annually renewed lines of credit to which the banks have not made a firm commitment. These renewable sources of finance are<br />
shown under current financial liabilities and described in note 18.2.1.<br />
Interest payable in future on variable rate loans has been estimated on the basis of the current interest rates at December 31, <strong>2011</strong>.<br />
Financial information concerning the issuer’s assets, financial position and result<br />
85


