2011 Annual report - touax group
2011 Annual report - touax group
2011 Annual report - touax group
Create successful ePaper yourself
Turn your PDF publications into a flip-book with our unique Google optimized e-Paper software.
<strong>Annual</strong> <strong>report</strong> <strong>2011</strong><br />
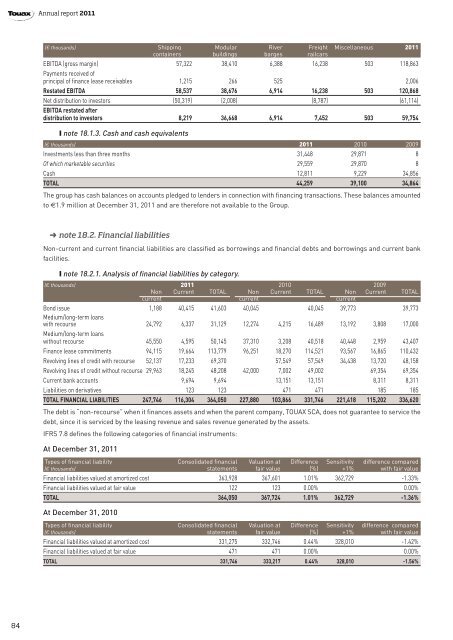
(€ thousands) Shipping Modular River Freight Miscellaneous <strong>2011</strong><br />
containers buildings barges railcars<br />
EBITDA (gross margin) 57,322 38,410 6,388 16,238 503 118,863<br />
Payments received of<br />
principal of finance lease receivables 1,215 266 525 2,006<br />
Restated EBITDA 58,537 38,676 6,914 16,238 503 120,868<br />
Net distribution to investors (50,319) (2,008) (8,787) (61,114)<br />
EBITDA restated after<br />
distribution to investors 8,219 36,668 6,914 7,452 503 59,754<br />
❙ note 18.1.3. Cash and cash equivalents<br />
(€ thousands) <strong>2011</strong> 2010 2009<br />
Investments less than three months 31,448 29,871 8<br />
Of which marketable securities 29,559 29,870 8<br />
Cash 12,811 9,229 34,856<br />
TOTAL 44,259 39,100 34,864<br />
The <strong>group</strong> has cash balances on accounts pledged to lenders in connection with financing transactions. These balances amounted<br />
to €1.9 million at December 31, <strong>2011</strong> and are therefore not available to the Group.<br />
➜ note 18.2. Financial liabilities<br />
Non-current and current financial liabilities are classified as borrowings and financial debts and borrowings and current bank<br />
facilities.<br />
❙ note 18.2.1. Analysis of financial liabilities by category.<br />
(€ thousands) <strong>2011</strong> 2010 2009<br />
Non Current TOTAL Non Current TOTAL Non Current TOTAL<br />
current current current<br />
Bond issue 1,188 40,415 41,603 40,045 40,045 39,773 39,773<br />
Medium/long-term loans<br />
with recourse 24,792 6,337 31,129 12,274 4,215 16,489 13,192 3,808 17,000<br />
Medium/long-term loans<br />
without recourse 45,550 4,595 50,145 37,310 3,208 40,518 40,448 2,959 43,407<br />
Finance lease commitments 94,115 19,664 113,779 96,251 18,270 114,521 93,567 16,865 110,432<br />
Revolving lines of credit with recourse 52,137 17,233 69,370 57,549 57,549 34,438 13,720 48,158<br />
Revolving lines of credit without recourse 29,963 18,245 48,208 42,000 7,002 49,002 69,354 69,354<br />
Current bank accounts 9,694 9,694 13,151 13,151 8,311 8,311<br />
Liabilities on derivatives 123 123 471 471 185 185<br />
TOTAL FINANCIAL LIABILITIES 247,746 116,304 364,050 227,880 103,866 331,746 221,418 115,202 336,620<br />
The debt is “non-recourse” when it finances assets and when the parent company, TOUAX SCA, does not guarantee to service the<br />
debt, since it is serviced by the leasing revenue and sales revenue generated by the assets.<br />
IFRS 7.8 defines the following categories of financial instruments:<br />
At December 31, <strong>2011</strong><br />
Types of financial liability Consolidated financial Valuation at Difference Sensitivity difference compared<br />
(€ thousands) statements fair value (%) +1% with fair value<br />
Financial liabilities valued at amortized cost 363,928 367,601 1.01% 362,729 -1.33%<br />
Financial liabilities valued at fair value 122 123 0.00% 0.00%<br />
TOTAL 364,050 367,724 1.01% 362,729 -1.36%<br />
At December 31, 2010<br />
Types of financial liability Consolidated financial Valuation at Difference Sensitivity difference compared<br />
(€ thousands) statements fair value (%) +1% with fair value<br />
Financial liabilities valued at amortized cost 331,275 332,746 0.44% 328,010 -1.42%<br />
Financial liabilities valued at fair value 471 471 0.00% 0.00%<br />
TOTAL 331,746 333,217 0.44% 328,010 -1.56%<br />
84


