2011 Annual report - touax group
2011 Annual report - touax group
2011 Annual report - touax group

You also want an ePaper? Increase the reach of your titles
YUMPU automatically turns print PDFs into web optimized ePapers that Google loves.
<strong>Annual</strong> <strong>report</strong> <strong>2011</strong><br />
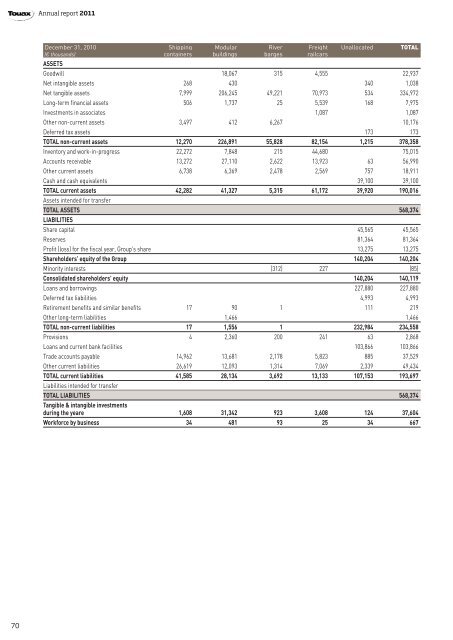
December 31, 2010 Shipping Modular River Freight Unallocated TOTAL<br />
(€ thousands) containers buildings barges railcars<br />
ASSETS<br />
Goodwill 18,067 315 4,555 22,937<br />
Net intangible assets 268 430 340 1,038<br />
Net tangible assets 7,999 206,245 49,221 70,973 534 334,972<br />
Long-term financial assets 506 1,737 25 5,539 168 7,975<br />
Investments in associates 1,087 1,087<br />
Other non-current assets 3,497 412 6,267 10,176<br />
Deferred tax assets 173 173<br />
TOTAL non-current assets 12,270 226,891 55,828 82,154 1,215 378,358<br />
Inventory and work-in-progress 22,272 7,848 215 44,680 75,015<br />
Accounts receivable 13,272 27,110 2,622 13,923 63 56,990<br />
Other current assets 6,738 6,369 2,478 2,569 757 18,911<br />
Cash and cash equivalents 39,100 39,100<br />
TOTAL current assets 42,282 41,327 5,315 61,172 39,920 190,016<br />
Assets intended for transfer<br />
TOTAL ASSETS 568,374<br />
LIABILITIES<br />
Share capital 45,565 45,565<br />
Reserves 81,364 81,364<br />
Profit (loss) for the fiscal year, Group's share 13,275 13,275<br />
Shareholders’ equity of the Group 140,204 140,204<br />
Minority interests (312) 227 (85)<br />
Consolidated shareholders' equity 140,204 140,119<br />
Loans and borrowings 227,880 227,880<br />
Deferred tax liabilities 4,993 4,993<br />
Retirement benefits and similar benefits 17 90 1 111 219<br />
Other long-term liabilities 1,466 1,466<br />
TOTAL non-current liabilities 17 1,556 1 232,984 234,558<br />
Provisions 4 2,360 200 241 63 2,868<br />
Loans and current bank facilities 103,866 103,866<br />
Trade accounts payable 14,962 13,681 2,178 5,823 885 37,529<br />
Other current liabilities 26,619 12,093 1,314 7,069 2,339 49,434<br />
TOTAL current liabilities 41,585 28,134 3,692 13,133 107,153 193,697<br />
Liabilities intended for transfer<br />
TOTAL LIABILITIES 568,374<br />
Tangible & intangible investments<br />
during the yeare 1,608 31,342 923 3,608 124 37,604<br />
Workforce by business 34 481 93 25 34 667<br />
70