2011 Annual report - touax group
2011 Annual report - touax group
2011 Annual report - touax group

You also want an ePaper? Increase the reach of your titles
YUMPU automatically turns print PDFs into web optimized ePapers that Google loves.
<strong>Annual</strong> <strong>report</strong> <strong>2011</strong><br />
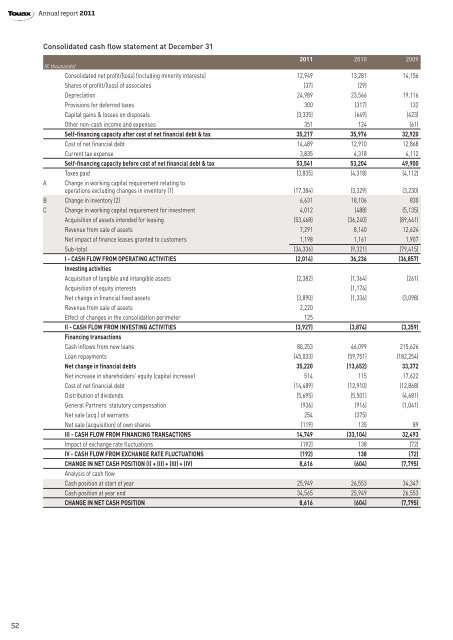
Consolidated cash flow statement at December 31<br />
(€ thousands)<br />
<strong>2011</strong> 2010 2009<br />
Consolidated net profit/(loss) (including minority interests) 12,949 13,281 14,156<br />
Shares of profilt/(loss) of associates (37) (29)<br />
Depreciation 24,989 23,566 19,116<br />
Provisions for deferred taxes 300 (317) 132<br />
Capital gains & losses on disposals (3,335) (649) (423)<br />
Other non-cash income and expenses 351 124 (61)<br />
Self-financing capacity after cost of net financial debt & tax 35,217 35,976 32,920<br />
Cost of net financial debt 14,489 12,910 12,868<br />
Current tax expense 3,835 4,318 4,112<br />
Self-financing capacity before cost of net financial debt & tax 53,541 53,204 49,900<br />
Taxes paid (3,835) (4,318) (4,112)<br />
A Change in working capital requirement relating to<br />
operations excluding changes in inventory (1) (17,384) (3,329) (3,230)<br />
B Change in inventory (2) 6,631 18,106 830<br />
C Change in working capital requirement for investment 4,012 (488) (5,135)<br />
Acquisition of assets intended for leasing (53,468) (36,240) (89,641)<br />
Revenue from sale of assets 7,291 8,140 12,624<br />
Net impact of finance leases granted to customers 1,198 1,161 1,907<br />
Sub-total (34,336) (9,321) (79,415)<br />
I - CASH FLOW FROM OPERATING ACTIVITIES (2,014) 36,236 (36,857)<br />
Investing activities<br />
Acquisition of tangible and intangible assets (2,382) (1,364) (261)<br />
Acquisition of equity interests (1,174)<br />
Net change in financial fixed assets (3,890) (1,336) (3,098)<br />
Revenue from sale of assets 2,220<br />
Effect of changes in the consolidation perimeter 125<br />
II - CASH FLOW FROM INVESTING ACTIVITIES (3,927) (3,874) (3,359)<br />
Financing transactions<br />
Cash inflows from new loans 80,253 46,099 215,626<br />
Loan repayments (45,033) (59,751) (182,254)<br />
Net change in financial debts 35,220 (13,652) 33,372<br />
Net increase in shareholders' equity (capital increase) 514 115 17,622<br />
Cost of net financial debt (14,489) (12,910) (12,868)<br />
Distribution of dividends (5,695) (5,501) (4,681)<br />
General Partners’ statutory compensation (936) (916) (1,041)<br />
Net sale (acq.) of warrants 254 (375)<br />
Net sale (acquisition) of own shares (119) 135 89<br />
III - CASH FLOW FROM FINANCING TRANSACTIONS 14,749 (33,104) 32,493<br />
Impact of exchange rate fluctuations (192) 138 (72)<br />
IV - CASH FLOW FROM EXCHANGE RATE FLUCTUATIONS (192) 138 (72)<br />
CHANGE IN NET CASH POSITION (I) + (II) + (III) + (IV) 8,616 (604) (7,795)<br />
Analysis of cash flow<br />
Cash position at start of year 25,949 26,553 34,347<br />
Cash position at year end 34,565 25,949 26,553<br />
CHANGE IN NET CASH POSITION 8,616 (604) (7,795)<br />
52