2011 Annual report - touax group
2011 Annual report - touax group
2011 Annual report - touax group

Create successful ePaper yourself
Turn your PDF publications into a flip-book with our unique Google optimized e-Paper software.
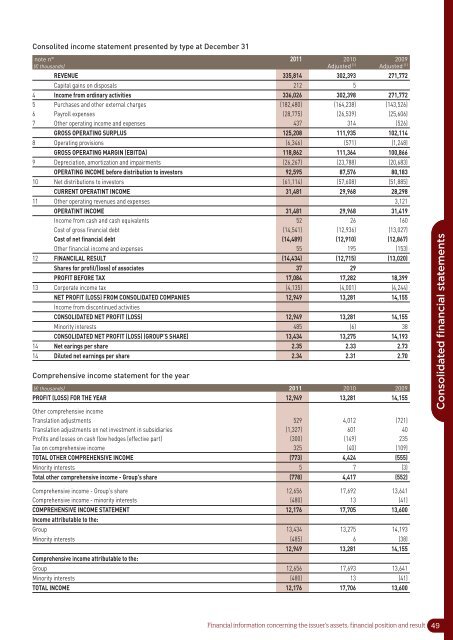
Consolited income statement presented by type at December 31<br />
note n° <strong>2011</strong> 2010 2009<br />
(€ thousands) Adjusted (1) Adjusted (1)<br />
REVENUE 335,814 302,393 271,772<br />
Capital gains on disposals 212 5<br />
4 Income from ordinary activities 336,026 302,398 271,772<br />
5 Purchases and other external charges (182,480) (164,238) (143,526)<br />
6 Payroll expenses (28,775) (26,539) (25,606)<br />
7 Other operating income and expenses 437 314 (526)<br />
GROSS OPERATING SURPLUS 125,208 111,935 102,114<br />
8 Operating provisions (6,346) (571) (1,248)<br />
GROSS OPERATING MARGIN (EBITDA) 118,862 111,364 100,866<br />
9 Depreciation, amortization and impairments (26,267) (23,788) (20,683)<br />
OPERATING INCOME before distribution to investors 92,595 87,576 80,183<br />
10 Net distributions to investors (61,114) (57,608) (51,885)<br />
CURRENT OPERATINT INCOME 31,481 29,968 28,298<br />
11 Other operating revenues and expenses 3,121<br />
OPERATINT INCOME 31,481 29,968 31,419<br />
Income from cash and cash equivalents 52 26 160<br />
Cost of gross financial debt (14,541) (12,936) (13,027)<br />
Cost of net financial debt (14,489) (12,910) (12,867)<br />
Other financial income and expenses 55 195 (153)<br />
12 FINANCILAL RESULT (14,434) (12,715) (13,020)<br />
Shares for profil/(loss) of associates 37 29<br />
PROFIT BEFORE TAX 17,084 17,282 18,399<br />
13 Corporate income tax (4,135) (4,001) (4,244)<br />
NET PROFIT (LOSS) FROM CONSOLIDATED COMPANIES 12,949 13,281 14,155<br />
Income from discontinued activities<br />
CONSOLIDATED NET PROFIT (LOSS) 12,949 13,281 14,155<br />
Minority interests 485 (6) 38<br />
CONSOLIDATED NET PROFIT (LOSS) (GROUP’S SHARE) 13,434 13,275 14,193<br />
14 Net earings per share 2.35 2.33 2.73<br />
14 Diluted net earnings per share 2.34 2.31 2.70<br />
Comprehensive income statement for the year<br />
(€ thousands) <strong>2011</strong> 2010 2009<br />
PROFIT (LOSS) FOR THE YEAR 12,949 13,281 14,155<br />
Other comprehensive income<br />
Translation adjustments 529 4,012 (721)<br />
Translation adjustments on net investment in subsidiaries (1,327) 601 40<br />
Profits and losses on cash flow hedges (effective part) (300) (149) 235<br />
Tax on comprehensive income 325 (40) (109)<br />
TOTAL OTHER COMPREHENSIVE INCOME (773) 4,424 (555)<br />
Minority interests 5 7 (3)<br />
Total other comprehensive income - Group's share (778) 4,417 (552)<br />
Consolidated financial statements<br />
Comprehensive income - Group's share 12,656 17,692 13,641<br />
Comprehensive income - minority interests (480) 13 (41)<br />
COMPREHENSIVE INCOME STATEMENT 12,176 17,705 13,600<br />
Income attributable to the:<br />
Group 13,434 13,275 14,193<br />
Minority interests (485) 6 (38)<br />
12,949 13,281 14,155<br />
Comprehensive income attributable to the:<br />
Group 12,656 17,693 13,641<br />
Minority interests (480) 13 (41)<br />
TOTAL INCOME 12,176 17,706 13,600<br />
Financial information concerning the issuer’s assets, financial position and result<br />
49