Raport Roczny Annual Report 2010 - Tauron
Raport Roczny Annual Report 2010 - Tauron
Raport Roczny Annual Report 2010 - Tauron

Create successful ePaper yourself
Turn your PDF publications into a flip-book with our unique Google optimized e-Paper software.
TAURON Polska Energia | <strong>Raport</strong> <strong>Roczny</strong> | <strong>Annual</strong> <strong>Report</strong> <strong>2010</strong><br />
Wyzwania stojące<br />
przed polską branżą energetyczną<br />
Najważniejszymi wyzwaniami, z jakimi w najbliższych latach<br />
będzie się musiała zmierzyć polska branża energetyczna, są<br />
ograniczenia w emisji dwutlenku węgla oraz modernizacja<br />
infrastruktury energetycznej. Działające w Polsce firmy energetyczne<br />
planują znaczne inwestycje, by sprostać wymogom<br />
stawianym przez Unię Europejską oraz zaspokoić rosnący popyt<br />
na energię elektryczną. Szczególnie intensywnie rozwijać<br />
się będzie produkcja energii ze źródeł odnawialnych oraz energetyka<br />
jądrowa.<br />
Wiele wątpliwości wciąż związanych jest z kwestią emisji dwutlenku<br />
węgla. Szczególnie duża emisja tego gazu towarzyszy<br />
wytwarzaniu energii w elektrowniach opalanych paliwami<br />
kopalnymi. Ograniczenia w tym zakresie wprowadził tzw. pakiet<br />
energetyczno-klimatyczny Unii Europejskiej. Zmniejszenie<br />
liczby nieodpłatnych uprawnień do emisji sprawia, że emisja<br />
dwutlenku węgla powodująca przekroczenie limitów wiąże<br />
się z koniecznością ponoszenia dodatkowych nakładów finansowych.<br />
Firmy energetyczne planują wielomiliardowe inwestycje.<br />
Cały rynek czeka jednak na decyzje dotyczące uprawnień<br />
do emisji dwutlenku węgla dla nowych mocy wytwórczych.<br />
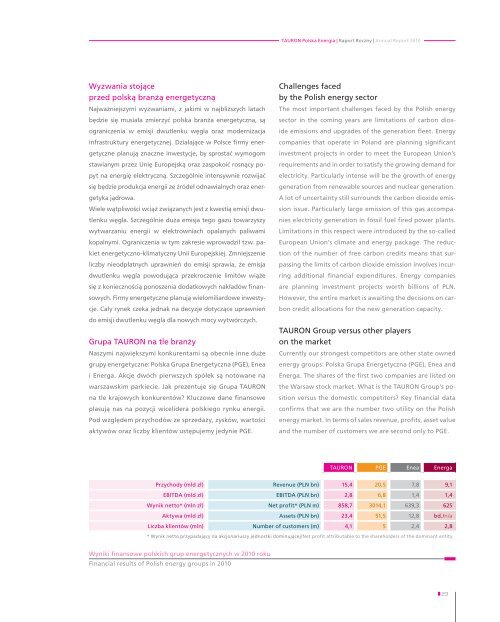
Grupa TAURON na tle branży<br />
Naszymi największymi konkurentami są obecnie inne duże<br />
grupy energetyczne: Polska Grupa Energetyczna (PGE), Enea<br />
i Energa. Akcje dwóch pierwszych spółek są notowane na<br />
warszawskim parkiecie. Jak prezentuje się Grupa TAURON<br />
na tle krajowych konkurentów Kluczowe dane finansowe<br />
plasują nas na pozycji wicelidera polskiego rynku energii.<br />
Pod względem przychodów ze sprzedaży, zysków, wartości<br />
aktywów oraz liczby klientów ustępujemy jedynie PGE.<br />
Challenges faced<br />
by the Polish energy sector<br />
The most important challenges faced by the Polish energy<br />
sector in the coming years are limitations of carbon dioxide<br />
emissions and upgrades of the generation fleet. Energy<br />
companies that operate in Poland are planning significant<br />
investment projects in order to meet the European Union’s<br />
requirements and in order to satisfy the growing demand for<br />
electricity. Particularly intense will be the growth of energy<br />
generation from renewable sources and nuclear generation.<br />
A lot of uncertainty still surrounds the carbon dioxide emission<br />
issue. Particularly large emission of this gas accompanies<br />
electricity generation in fossil fuel fired power plants.<br />
Limitations in this respect were introduced by the so-called<br />
European Union’s climate and energy package. The reduction<br />
of the number of free carbon credits means that surpassing<br />
the limits of carbon dioxide emission involves incurring<br />
additional financial expenditures. Energy companies<br />
are planning investment projects worth billions of PLN.<br />
However, the entire market is awaiting the decisions on carbon<br />
credit allocations for the new generation capacity.<br />
TAURON Group versus other players<br />
on the market<br />
Currently our strongest competitors are other state owned<br />
energy groups: Polska Grupa Energetyczna (PGE), Enea and<br />
Energa. The shares of the first two companies are listed on<br />
the Warsaw stock market. What is the TAURON Group’s position<br />
versus the domestic competitors Key financial data<br />
confirms that we are the number two utility on the Polish<br />
energy market. In terms of sales revenue, profits, asset value<br />
and the number of customers we are second only to PGE.<br />
TAURON PGE Enea Energa<br />
Przychody (mld zł) Revenue (PLN bn) 15,4 20,5 7,8 9,1<br />
EBITDA (mld zł) EBITDA (PLN bn) 2,8 6,8 1,4 1,4<br />
Wynik netto* (mln zł) Net profit* (PLN m) 858,7 3014,1 639,3 625<br />
Aktywa (mld zł) Assets (PLN bn) 23,4 51,5 12,8 bd./n/a<br />
Liczba klientów (mln) Number of customers (m) 4,1 5 2,4 2,8<br />
* Wynik netto przypadający na akcjonariuszy jednostki dominującej/Net profit attributable to the shareholders of the dominant entity<br />
Wyniki finansowe polskich grup energetycznych w <strong>2010</strong> roku<br />
Financial results of Polish energy groups in <strong>2010</strong><br />
23