Raport Roczny Annual Report 2010 - Tauron
Raport Roczny Annual Report 2010 - Tauron
Raport Roczny Annual Report 2010 - Tauron

Create successful ePaper yourself
Turn your PDF publications into a flip-book with our unique Google optimized e-Paper software.
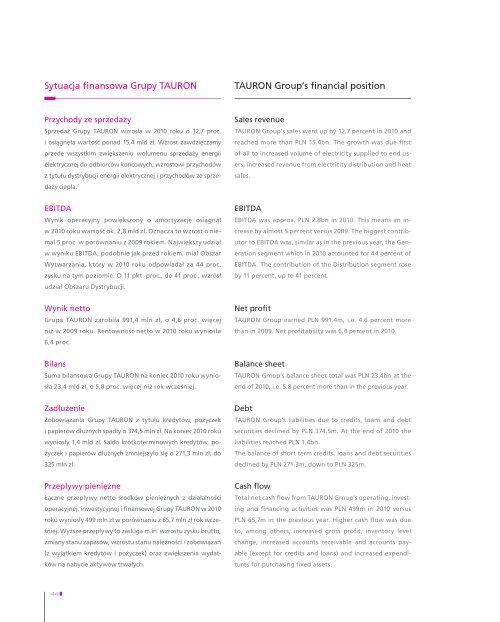
Sytuacja finansowa Grupy TAURON<br />
TAURON Group’s financial position<br />
Przychody ze sprzedaży<br />
Sprzedaż Grupy TAURON wzrosła w <strong>2010</strong> roku o 12,7 proc.<br />
i osiągnęła wartość ponad 15,4 mld zł. Wzrost zawdzięczamy<br />
przede wszystkim zwiększeniu wolumenu sprzedaży energii<br />
elektrycznej do odbiorców końcowych, wzrostowi przychodów<br />
z tytułu dystrybucji energii elektrycznej i przychodów ze sprzedaży<br />
ciepła.<br />
EBITDA<br />
Wynik operacyjny powiększony o amortyzację osiągnął<br />
w <strong>2010</strong> roku wartość ok. 2,8 mld zł. Oznacza to wzrost o niemal<br />
5 proc. w porównaniu z 2009 rokiem. Największy udział<br />
w wyniku EBITDA, podobnie jak przed rokiem, miał Obszar<br />
Wytwarzania, który w <strong>2010</strong> roku odpowiadał za 44 proc.<br />
zysku na tym poziomie. O 11 pkt. proc., do 41 proc., wzrósł<br />
udział Obszaru Dystrybucji.<br />
Wynik netto<br />
Grupa TAURON zarobiła 991,4 mln zł, o 4,6 proc. więcej<br />
niż w 2009 roku. Rentowność netto w <strong>2010</strong> roku wyniosła<br />
6,4 proc.<br />
Bilans<br />
Suma bilansowa Grupy TAURON na koniec <strong>2010</strong> roku wyniosła<br />
23,4 mld zł, o 5,8 proc. więcej niż rok wcześniej.<br />
Zadłużenie<br />
Zobowiązania Grupy TAURON z tytułu kredytów, pożyczek<br />
i papierów dłużnych spadły o 374,5 mln zł. Na koniec <strong>2010</strong> roku<br />
wyniosły 1,4 mld zł. Saldo krótkoterminowych kredytów, pożyczek<br />
i papierów dłużnych zmniejszyło się o 271,3 mln zł, do<br />
325 mln zł.<br />
Przepływy pieniężne<br />
Łączne przepływy netto środków pieniężnych z działalności<br />
operacyjnej, inwestycyjnej i finansowej Grupy TAURON w <strong>2010</strong><br />
roku wyniosły 499 mln zł w porównaniu z 65,7 mln zł rok wcześniej.<br />
Wyższe przepływy to zasługa m.in. wzrostu zysku brutto,<br />
zmiany stanu zapasów, wzrostu stanu należności i zobowiązań<br />
(z wyjątkiem kredytów i pożyczek) oraz zwiększenia wydatków<br />
na nabycie aktywów trwałych.<br />
Sales revenue<br />
TAURON Group’s sales went up by 12.7 percent in <strong>2010</strong> and<br />
reached more than PLN 15.4bn. The growth was due first<br />
of all to increased volume of electricity supplied to end users,<br />
increased revenue from electricity distribution and heat<br />
sales.<br />
EBITDA<br />
EBITDA was approx. PLN 2.8bn in <strong>2010</strong>. This means an increase<br />
by almost 5 percent versus 2009. The biggest contributor<br />
to EBITDA was, similar as in the previous year, the Generation<br />
segment which in <strong>2010</strong> accounted for 44 percent of<br />
EBITDA. The contribution of the Distribution segment rose<br />
by 11 percent, up to 41 percent.<br />
Net profit<br />
TAURON Group earned PLN 991.4m, i.e. 4.6 percent more<br />
than in 2009. Net profitability was 6.4 percent in <strong>2010</strong>.<br />
Balance sheet<br />
TAURON Group’s balance sheet total was PLN 23.4bn at the<br />
end of <strong>2010</strong>, i.e. 5.8 percent more than in the previous year.<br />
Debt<br />
TAURON Group’s liabilities due to credits, loans and debt<br />
securities declined by PLN 374.5m. At the end of <strong>2010</strong> the<br />
liabilities reached PLN 1.4bn.<br />
The balance of short term credits, loans and debt securities<br />
declined by PLN 271.3m, down to PLN 325m.<br />
Cash flow<br />
Total net cash flow from TAURON Group’s operating, investing<br />
and financing activities was PLN 499m in <strong>2010</strong> versus<br />
PLN 65,7m in the previous year. Higher cash flow was due<br />
to, among others, increased gross profit, inventory level<br />
change, increased accounts receivable and accounts payable<br />
(except for credits and loans) and increased expenditures<br />
for purchasing fixed assets.<br />
44