Hope Not Hype - Third World Network
Hope Not Hype - Third World Network
Hope Not Hype - Third World Network
- No tags were found...

Create successful ePaper yourself
Turn your PDF publications into a flip-book with our unique Google optimized e-Paper software.
Biotechnologies for Sustainable Cultures<br />
93<br />
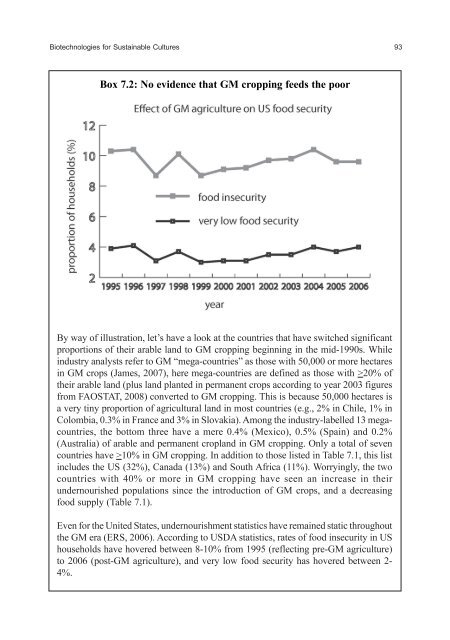
Box 7.2: No evidence that GM cropping feeds the poor<br />
By way of illustration, let’s have a look at the countries that have switched significant<br />
proportions of their arable land to GM cropping beginning in the mid-1990s. While<br />
industry analysts refer to GM “mega-countries” as those with 50,000 or more hectares<br />
in GM crops (James, 2007), here mega-countries are defined as those with >20% of<br />
their arable land (plus land planted in permanent crops according to year 2003 figures<br />
from FAOSTAT, 2008) converted to GM cropping. This is because 50,000 hectares is<br />
a very tiny proportion of agricultural land in most countries (e.g., 2% in Chile, 1% in<br />
Colombia, 0.3% in France and 3% in Slovakia). Among the industry-labelled 13 megacountries,<br />
the bottom three have a mere 0.4% (Mexico), 0.5% (Spain) and 0.2%<br />
(Australia) of arable and permanent cropland in GM cropping. Only a total of seven<br />
countries have >10% in GM cropping. In addition to those listed in Table 7.1, this list<br />
includes the US (32%), Canada (13%) and South Africa (11%). Worryingly, the two<br />
countries with 40% or more in GM cropping have seen an increase in their<br />
undernourished populations since the introduction of GM crops, and a decreasing<br />
food supply (Table 7.1).<br />
Even for the United States, undernourishment statistics have remained static throughout<br />
the GM era (ERS, 2006). According to USDA statistics, rates of food insecurity in US<br />
households have hovered between 8-10% from 1995 (reflecting pre-GM agriculture)<br />
to 2006 (post-GM agriculture), and very low food security has hovered between 2-<br />
4%.