Hope Not Hype - Third World Network
Hope Not Hype - Third World Network
Hope Not Hype - Third World Network
- No tags were found...

You also want an ePaper? Increase the reach of your titles
YUMPU automatically turns print PDFs into web optimized ePapers that Google loves.
46 <strong>Hope</strong> <strong>Not</strong> <strong>Hype</strong><br />
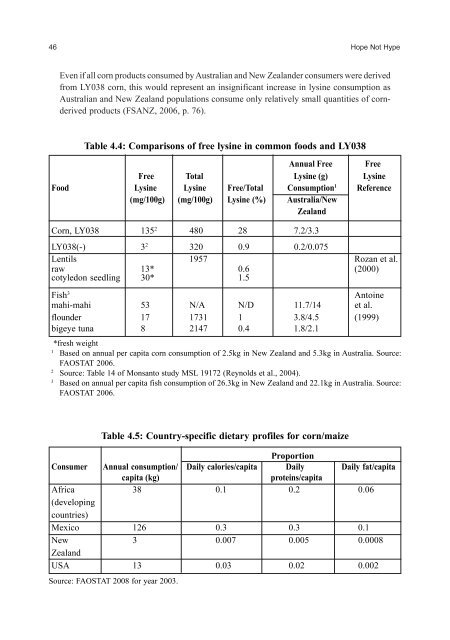
Even if all corn products consumed by Australian and New Zealander consumers were derived<br />
from LY038 corn, this would represent an insignificant increase in lysine consumption as<br />
Australian and New Zealand populations consume only relatively small quantities of cornderived<br />
products (FSANZ, 2006, p. 76).<br />
Table 4.4: Comparisons of free lysine in common foods and LY038<br />
Annual Free Free<br />
Free Total Lysine (g) Lysine<br />
Food Lysine Lysine Free/Total Consumption 1 Reference<br />
(mg/100g) (mg/100g) Lysine (%) Australia/New<br />
Zealand<br />
Corn, LY038 135 2 480 28 7.2/3.3<br />
LY038(-)3 2 320 0.9 0.2/0.075<br />
Lentils 1957 Rozan et al.<br />
raw 13* 0.6 (2000)<br />
cotyledon seedling 30* 1.5<br />
Fish 3<br />
Antoine<br />
mahi-mahi 53 N/A N/D 11.7/14 et al.<br />
flounder 17 1731 1 3.8/4.5 (1999)<br />
bigeye tuna 8 2147 0.4 1.8/2.1<br />
*fresh weight<br />
1<br />
Based on annual per capita corn consumption of 2.5kg in New Zealand and 5.3kg in Australia. Source:<br />
FAOSTAT 2006.<br />
2<br />
Source: Table 14 of Monsanto study MSL 19172 (Reynolds et al., 2004).<br />
3<br />
Based on annual per capita fish consumption of 26.3kg in New Zealand and 22.1kg in Australia. Source:<br />
FAOSTAT 2006.<br />
Table 4.5: Country-specific dietary profiles for corn/maize<br />
Proportion<br />
Consumer Annual consumption/ Daily calories/capita Daily Daily fat/capita<br />
capita (kg) proteins/capita<br />
Africa 38 0.1 0.2 0.06<br />
(developing<br />
countries)<br />
Mexico 126 0.3 0.3 0.1<br />
New 3 0.007 0.005 0.0008<br />
Zealand<br />
USA 13 0.03 0.02 0.002<br />
Source: FAOSTAT 2008 for year 2003.