2005 State of Mobility Report - City of Bellevue
2005 State of Mobility Report - City of Bellevue
2005 State of Mobility Report - City of Bellevue

You also want an ePaper? Increase the reach of your titles
YUMPU automatically turns print PDFs into web optimized ePapers that Google loves.
CHAPTER 3<br />
Level <strong>of</strong> Service and Concurrency<br />
3<br />
<strong>Bellevue</strong>’s transportation system continues to function efficiently, in part because the <strong>City</strong> monitors current<br />
traffic conditions and then incorporates that information into accurate forecasts about the future service<br />
quality <strong>of</strong> transportation facilities. The use <strong>of</strong> a sophisticated regional travel model to define local needs<br />
supports the <strong>City</strong> in:<br />
• realistically assessing the impacts <strong>of</strong> proposed development or land use code amendments;<br />
• systematically prioritizing infrastructure improvement projects during the investment planning process; and<br />
• annually fulfilling the requirements <strong>of</strong> the state’s Growth Management Act.<br />
Assessing the efficiency <strong>of</strong> the local transportation system, now and into the future, requires three steps: data<br />
collection, analysis & forecasting, and application. This chapter will highlight common element(s) related to each step.<br />
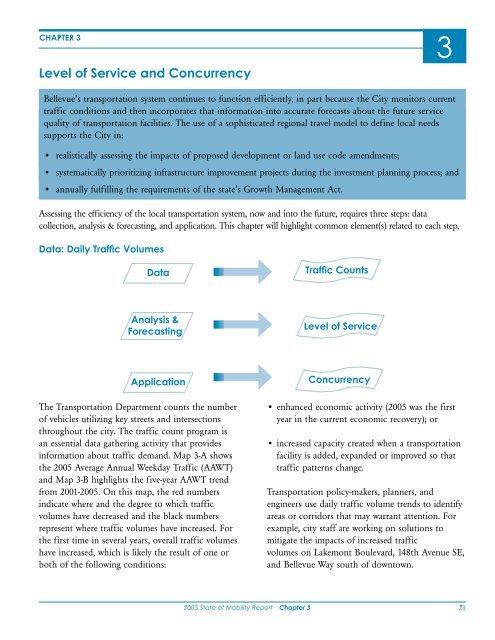
Data: Daily Traffic Volumes<br />
Data<br />
Traffic Counts<br />
Analysis &<br />
Forecasting<br />
Level <strong>of</strong> Service<br />
Application<br />
The Transportation Department counts the number<br />
<strong>of</strong> vehicles utilizing key streets and intersections<br />
throughout the city. The traffic count program is<br />
an essential data gathering activity that provides<br />
information about traffic demand. Map 3-A shows<br />
the <strong>2005</strong> Average Annual Weekday Traffic (AAWT)<br />
and Map 3-B highlights the five-year AAWT trend<br />
from 2001-<strong>2005</strong>. On this map, the red numbers<br />
indicate where and the degree to which traffic<br />
volumes have decreased and the black numbers<br />
represent where traffic volumes have increased. For<br />
the first time in several years, overall traffic volumes<br />
have increased, which is likely the result <strong>of</strong> one or<br />
both <strong>of</strong> the following conditions:<br />
Concurrency<br />
• enhanced economic activity (<strong>2005</strong> was the first<br />
year in the current economic recovery); or<br />
• increased capacity created when a transportation<br />
facility is added, expanded or improved so that<br />
traffic patterns change.<br />
Transportation policy-makers, planners, and<br />
engineers use daily traffic volume trends to identify<br />
areas or corridors that may warrant attention. For<br />
example, city staff are working on solutions to<br />
mitigate the impacts <strong>of</strong> increased traffic<br />
volumes on Lakemont Boulevard, 148th Avenue SE,<br />
and <strong>Bellevue</strong> Way south <strong>of</strong> downtown.<br />
<strong>2005</strong> <strong>State</strong> <strong>of</strong> <strong>Mobility</strong> <strong>Report</strong> Chapter 3<br />
21