V. Focused Fundamental Research - EERE - U.S. Department of ...
V. Focused Fundamental Research - EERE - U.S. Department of ...
V. Focused Fundamental Research - EERE - U.S. Department of ...

Create successful ePaper yourself
Turn your PDF publications into a flip-book with our unique Google optimized e-Paper software.
Newman – LBNL<br />
V.E.5 Analysis and Simulation <strong>of</strong> Electrochemical Energy Systems (LBNL)<br />
Current, mA/cm 2<br />
0.00<br />
-0.02<br />
-0.04<br />
-0.06<br />
-0.08<br />
-0.10<br />
-0.12<br />
30 min<br />
60 min<br />
6 min<br />
30 sec<br />
-0.14<br />
Reversible<br />
2.0 2.5 3.0<br />
Imaginary impedance, kOhm-cm 2<br />
4<br />
3<br />
2<br />
1<br />
30 min<br />
60 min<br />
30 sec<br />
6 min<br />
0<br />
0 2 4 6 8<br />
Real impedance, kOhm-cm 2<br />
Voltage vs. Li/Li +<br />
Figure V - 202: Nyquist plot <strong>of</strong> electrode after different lengths <strong>of</strong> passivation<br />
holds. Longer passivation times cause higher impedance.<br />
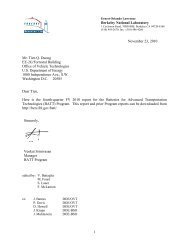
Figure V - 201: Steady-state current vs. voltage after different lengths <strong>of</strong><br />
passivation holds. Markers are measurements, dashed lines are model fits. 10<br />
Both the exchange current density i0 and the through-film limiting current ilim<br />
decrease. Data is measured at 900 rpm with 1.1 mM ferrocene/ferrocenium<br />
60 min<br />
30 min<br />
hexafluorophosphate.<br />
1<br />
The shape <strong>of</strong> the curve between 3.15 and 2.5 V is<br />
given by α and i 0 . i lim is determined from the limit as the<br />
curve approaches very low voltages. Both i 0 and i lim<br />
decrease with increased passivation time, and because both<br />
expressions contain the porosity ε, a possible explanation<br />
may be that longer formation times cause thicker but also<br />
less porous films.<br />
2. Impedance characterization. Figure V - 202 shows<br />
impedance measurements <strong>of</strong> the same films as in Fig. 1 at<br />
open circuit potential and 900 rpm. Each spectrum<br />
exhibits two arcs. The high-frequency arc depends on<br />
passivation time, but the low-frequency arc does not. The<br />
high-frequency arc width increases with more passivation<br />
time. Plotting the imaginary component vs. frequency<br />
(Figure V - 203) shows that, similarly, the low-frequency peak<br />
is independent <strong>of</strong> passivation time, but the high-frequency<br />
peak decreases with passivation time. The peak frequency<br />
corresponds to the reciprocal <strong>of</strong> the time constant <strong>of</strong> the<br />
system, τ = R ct C dl , where R ct is the charge-transfer<br />
resistance and C dl is the double-layer capacitance. As<br />
formation time increases, the time constant increases,<br />
corresponding to a higher charge-transfer resistance or a<br />
slower reaction. These observations agree qualitatively<br />
with the steady-state findings.<br />
Imaginary impedance, kOhm-cm 2<br />
0.1<br />
0.01<br />
0.001<br />
6 min<br />
30 sec<br />
0.0001<br />
10 -1 10 1 10 3 10 5<br />
Frequency, rad/s<br />
Figure V - 203: Bode plot <strong>of</strong> electrode after different lengths <strong>of</strong> passivation<br />
holds. The high-frequency peak depends on passivation time, but the lowfrequency<br />
peak does not.<br />
3. Effect <strong>of</strong> HOPG orientation. Although<br />
comparison <strong>of</strong> the experimental EIS data with a physicsbased<br />
model shows that EIS does not provide as unique a<br />
fit as the steady-state measurements, the indicators <strong>of</strong> highfrequency<br />
arc width and time constant agree qualitatively<br />
with steady-state results. Impedance also has significant<br />
experimental advantages over the rotating disk electrode; it<br />
is faster, uses less material, and is less subject to variations<br />
in temperature and bulk concentration. Most importantly, it<br />
permits the use <strong>of</strong> more materials, including those actually<br />
found in lithium-ion batteries. Previous work has found<br />
that the SEI formation reactions may differ substantially<br />
on the edge and basal planes <strong>of</strong> graphite; accordingly, the<br />
current task is to use the method developed in this work to<br />
study how passivation differs with graphite orientation. A<br />
preliminary result from this study is shown in Figure V - 204.<br />
Two samples <strong>of</strong> HOPG, one with an edge fraction <strong>of</strong> 0.06<br />
(primarily the basal surface exposed) and the other with an<br />
edge fraction <strong>of</strong> 0.6 (primarily the edge fraction exposed)<br />
FY 2011 Annual Progress Report 645 Energy Storage R&D