V. Focused Fundamental Research - EERE - U.S. Department of ...
V. Focused Fundamental Research - EERE - U.S. Department of ...
V. Focused Fundamental Research - EERE - U.S. Department of ...

Create successful ePaper yourself
Turn your PDF publications into a flip-book with our unique Google optimized e-Paper software.
V.B.13 Studies on the Local SOC and Underlying Structures in Lithium Battery Electrodes (ORNL)<br />
Nanda – ORNL<br />
350<br />
Capacity (mAhg -1 )<br />
300<br />
250<br />
200<br />
150<br />
100<br />
50<br />
C/10 4.9V<br />
Charge<br />
Discharge<br />
Figure V - 68: Raman maps showing local SOC varition across NCA<br />
electrodes cycled at 4.1 V under constant current condition at 3C with 1 hour<br />
PS. SOC plots show the local inhomogeneity across the electrode surface<br />
and could vary under electrochemical conditions.<br />
Using a similar approach, we also undertook Raman<br />
mapping <strong>of</strong> high voltage Li-rich MNC composite cathodes<br />
under both cycled as well as pristine electrode conditions.<br />
Figure V - 69 shows the micro-Raman mapping/imaging <strong>of</strong><br />
the pristine Li 1.2 Ni 0.175 Co 0.1 Mn 0.525 O 2 electrode showing<br />
the carbon and active material region at a micrometer<br />
resolution. We are currently comparing the SOC Raman<br />
maps with cycled Li-rich MNC electrodes.<br />
0<br />
0 20 40 60 80 100 120 140 160 180 200<br />
Cycle number<br />
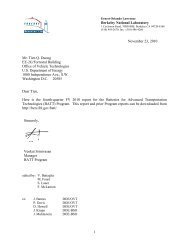
Figure V - 70: Capacity as a function <strong>of</strong> Cycle number for pristine<br />
Li1.2Ni0.175Co0.1Mn0.525O2 with 1.5 wt% CNF<br />
Figure V - 71 includes the first charging pr<strong>of</strong>ile showing<br />
the high voltage plateaus at 4.5 V responsible for the<br />
higher capacity. The discharge pr<strong>of</strong>iles are shown at the<br />
end <strong>of</strong> 1, 5, 50 and 200 cycles. With successive cycling the<br />
discharge pr<strong>of</strong>ile shifts to lower voltage indicating loss <strong>of</strong><br />
energy, although the total capacity remains the same. This<br />
is an important technical barrier that needs to addressed or<br />
understood before moving forward for using this material<br />
for EV application. Literature results on similar<br />
compositions point to complex structural transitions during<br />
higher voltage charge-discharge as a possible loss <strong>of</strong> the<br />
voltage pr<strong>of</strong>ile.<br />
5.0<br />
Figure V - 69: Micro-Raman mapping <strong>of</strong> the pristine<br />
Li1.2Ni0.175Co0.1Mn0.525O2 electrode<br />
Electrochemical benchmarking <strong>of</strong> Toda’s high<br />
voltage Li-rich MNC composition. We have investigated<br />
the high voltage cycling performance <strong>of</strong> the excess Li<br />
MNC composition. Figure V - 70 and Figure V - 71 show the<br />
capacity versus the cycle number and the discharge voltage<br />
pr<strong>of</strong>iles at successive cycles. The typical compositions <strong>of</strong><br />
these electrodes were 85 % active material, 6 % carbon<br />
black, 1.5 % carbon nan<strong>of</strong>ibers (CNF) and 7.5% PVDF.<br />
They were cycled up to 4.9V using standard 1.2M LiPF 6 /<br />
EC-DMC (1:2 w/w). The bare Li 1.2 Ni 0.175 Co 0.1 Mn 0.525 O 2<br />
composition showed a gradual capacity loss when cycled<br />
over 200 cycles (about 3.5 %) at 4.9 V. The CNF was<br />
used to improve the rate performance. (see next section).<br />
Voltage (V) vs. Li/Li +<br />
4.5<br />
4.0<br />
3.5<br />
3.0<br />
2.5<br />
1<br />
5 1<br />
5<br />
50<br />
50<br />
100<br />
100<br />
200 200<br />
0 50 100 150 200 250 300<br />
Capacity (mAhg -1 )<br />
Figure V - 71: Voltage pr<strong>of</strong>ile at 1 st , 5 th , 50 th , 100 th and 200 th cycles.<br />
Rate Performance. In order to address the issue <strong>of</strong><br />
rate performance, we have for the first time reported an<br />
increase <strong>of</strong> about a factor <strong>of</strong> two rate capability <strong>of</strong> the<br />
excess Lithia composition by addition <strong>of</strong> a nominal<br />
amount <strong>of</strong> highly graphitic carbon nan<strong>of</strong>iber, CNF (1.5<br />
wt%). In Figure V - 72 we show the comparison <strong>of</strong> the<br />
capacity and rate performance up to 100 cycles between<br />
the CNF electrode and the standard electrode composition<br />
Energy Storage R &D 530 FY 2011 Annual Progress Report