The obesogenic effects of polyunsaturated fatty acids are dependent ...
The obesogenic effects of polyunsaturated fatty acids are dependent ...
The obesogenic effects of polyunsaturated fatty acids are dependent ...

Create successful ePaper yourself
Turn your PDF publications into a flip-book with our unique Google optimized e-Paper software.
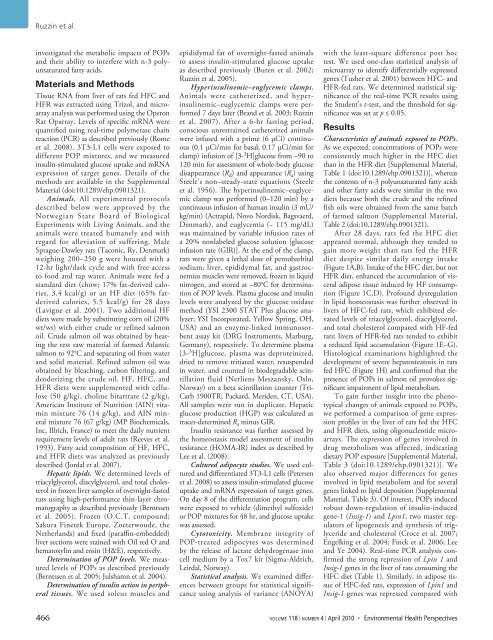
Ruzzin et al.<br />
investigated the metabolic impacts <strong>of</strong> POPs<br />
and their ability to interfere with n-3 <strong>polyunsaturated</strong><br />
<strong>fatty</strong> <strong>acids</strong>.<br />
Materials and Methods<br />
Tissue RNA from liver <strong>of</strong> rats fed HFC and<br />
HFR was extracted using Trizol, and microarray<br />
analysis was performed using the Operon<br />
Rat Oparray. Levels <strong>of</strong> specific mRNA were<br />
quantified using real-time polymerase chain<br />
reaction (PCR) as described previously (Rome<br />
et al. 2008). 3T3-L1 cells were exposed to<br />
different POP mixtures, and we measured<br />
insulin-stimulated glucose uptake and mRNA<br />
expression <strong>of</strong> target genes. Details <strong>of</strong> the<br />
methods <strong>are</strong> available in the Supplemental<br />
Material (doi:10.1289/ehp.0901321).<br />
Animals. All experimental protocols<br />
described below were approved by the<br />
Norwegian State Board <strong>of</strong> Biological<br />
Experiments with Living Animals, and the<br />
animals were treated humanely and with<br />
regard for alleviation <strong>of</strong> suffering. Male<br />
Sprague-Dawley rats (Taconic, Ry, Denmark)<br />
weighing 200–250 g were housed with a<br />
12-hr light/dark cycle and with free access<br />
to food and tap water. Animals were fed a<br />
standard diet (chow; 17% fat-derived calories,<br />
3.4 kcal/g) or an HF diet (65% fatderived<br />
calories, 5.5 kcal/g) for 28 days<br />
(Lavigne et al. 2001). Two additional HF<br />
diets were made by substituting corn oil (20%<br />
wt/wt) with either crude or refined salmon<br />
oil. Crude salmon oil was obtained by heating<br />
the rest raw material <strong>of</strong> farmed Atlantic<br />
salmon to 92°C and separating oil from water<br />
and solid material. Refined salmon oil was<br />
obtained by bleaching, carbon filtering, and<br />
deodorizing the crude oil. HF, HFC, and<br />
HFR diets were supplemented with cellulose<br />
(50 g/kg), choline bitartrate (2 g/kg),<br />
American Institute <strong>of</strong> Nutrition (AIN) vitamin<br />
mixture 76 (14 g/kg), and AIN mineral<br />
mixture 76 (67 g/kg) (MP Biochemicals,<br />
Inc, Illrich, France) to meet the daily nutrient<br />
requirement levels <strong>of</strong> adult rats (Reeves et al.<br />
1993). Fatty acid composition <strong>of</strong> HF, HFC,<br />
and HFR diets was analyzed as previously<br />
described (Jordal et al. 2007).<br />
Hepatic lipids. We determined levels <strong>of</strong><br />
triacylglycerol, diacyl glycerol, and total cholesterol<br />
in frozen liver samples <strong>of</strong> overnight-fasted<br />
rats using high-performance thin-layer chromatography<br />
as described previously (Berntssen<br />
et al. 2005). Frozen (O.C.T. compound;<br />
Sakura Finetek Europe, Zoeterwoude, the<br />
Netherlands) and fixed (paraffin-embedded)<br />
liver sections were stained with Oil red O and<br />
hematoxylin and eosin (H&E), respectively.<br />
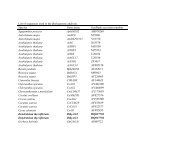
Determination <strong>of</strong> POP levels. We measured<br />
levels <strong>of</strong> POPs as described previously<br />
(Berntssen et al. 2005; Julshamn et al. 2004).<br />
Determination <strong>of</strong> insulin action in peripheral<br />
tissues. We used soleus muscles and<br />
epididymal fat <strong>of</strong> overnight-fasted animals<br />
to assess insulin-stimulated glucose uptake<br />
as described previously (Buren et al. 2002;<br />
Ruzzin et al. 2005).<br />
Hyperinsulinemic–euglycemic clamps.<br />
Animals were catheterized, and hyperinsulinemic–euglycemic<br />
clamps were performed<br />
7 days later (Brand et al. 2003; Ruzzin<br />
et al. 2007). After a 6-hr fasting period,<br />
conscious unrestrained catheterized animals<br />
were infused with a prime (6 µCi) continuous<br />
(0.1 µCi/min for basal; 0.17 µCi/min for<br />
clamp) infusion <strong>of</strong> [3- 3 H]glucose from –90 to<br />
120 min for assessment <strong>of</strong> whole-body glucose<br />
disappearance (R d ) and appearance (R a ) using<br />
Steele’s non–steady-state equations (Steele<br />
et al. 1956). <strong>The</strong> hyperinsulinemic–euglycemic<br />
clamp was performed (0–120 min) by a<br />
continuous infusion <strong>of</strong> human insulin (3 mU/<br />
kg/min) (Actrapid, Novo Nordisk, Bagsvaerd,<br />
Denmark), and euglycemia (~ 115 mg/dL)<br />
was maintained by variable infusion rates <strong>of</strong><br />
a 20% non labeled glucose solution [glucose<br />
infusion rate (GIR)]. At the end <strong>of</strong> the clamp,<br />
rats were given a lethal dose <strong>of</strong> pento barbital<br />
sodium; liver, epididymal fat, and gastrocnemius<br />
muscles were removed, frozen in liquid<br />
nitrogen, and stored at –80°C for determination<br />
<strong>of</strong> POP levels. Plasma glucose and insulin<br />
levels were analyzed by the glucose oxidase<br />
method (YSI 2300 STAT Plus glucose analyzer;<br />
YSI Incorporated, Yellow Spring, OH,<br />
USA) and an enzyme-linked immunosorbent<br />
assay kit (DRG Instruments, Marburg,<br />
Germany), respectively. To determine plasma<br />
[3- 3 H]glucose, plasma was deproteinized,<br />
dried to remove tritiated water, resuspended<br />
in water, and counted in biodegradable scintillation<br />
fluid (Nerliens Meszansky, Oslo,<br />
Norway) on a beta scintillation counter (Tri-<br />
Carb 1900TR; Packard, Meriden, CT, USA).<br />
All samples were run in duplicate. Hepatic<br />
glucose production (HGP) was calculated as<br />
tracer-determined R a minus GIR.<br />
Insulin resistance was further assessed by<br />
the homeostasis model assessment <strong>of</strong> insulin<br />
resistance (HOMA-IR) index as described by<br />
Lee et al. (2008).<br />
Cultured adipocyte studies. We used cultured<br />
and differentiated 3T3-L1 cells (Petersen<br />
et al. 2008) to assess insulin-stimulated glucose<br />
uptake and mRNA expression <strong>of</strong> target genes.<br />
On day 8 <strong>of</strong> the differentiation program, cells<br />
were exposed to vehicle (dimethyl sulfoxide)<br />
or POP mixtures for 48 hr, and glucose uptake<br />
was assessed.<br />
Cytotoxicity. Membrane integrity <strong>of</strong><br />
POP-treated adipocytes was determined<br />
by the release <strong>of</strong> lactate dehydrogenase into<br />
cell medium by a Tox7 kit (Sigma-Aldrich,<br />
Leirdal, Norway).<br />
Statistical analysis. We examined differences<br />
between groups for statistical significance<br />
using analysis <strong>of</strong> variance (ANOVA)<br />
with the least-squ<strong>are</strong> difference post hoc<br />
test. We used one-class statistical analysis <strong>of</strong><br />
microarray to identify differentially expressed<br />
genes (Tusher et al. 2001) between HFC- and<br />
HFR-fed rats. We determined statistical significance<br />
<strong>of</strong> the real-time PCR results using<br />
the Student’s t-test, and the threshold for significance<br />
was set at p ≤ 0.05.<br />
Results<br />
Characteristics <strong>of</strong> animals exposed to POPs.<br />
As we expected, concentrations <strong>of</strong> POPs were<br />
consistently much higher in the HFC diet<br />
than in the HFR diet [Supplemental Material,<br />
Table 1 (doi:10.1289/ehp.0901321)], whereas<br />
the contents <strong>of</strong> n-3 <strong>polyunsaturated</strong> <strong>fatty</strong> <strong>acids</strong><br />
and other <strong>fatty</strong> <strong>acids</strong> were similar in the two<br />
diets because both the crude and the refined<br />
fish oils were obtained from the same batch<br />
<strong>of</strong> farmed salmon (Supplemental Material,<br />
Table 2 (doi:10.1289/ehp.0901321).<br />
After 28 days, rats fed the HFC diet<br />
appe<strong>are</strong>d normal, although they tended to<br />
gain more weight than rats fed the HFR<br />
diet despite similar daily energy intake<br />
(Figure 1A,B). Intake <strong>of</strong> the HFC diet, but not<br />
HFR diet, enhanced the accumulation <strong>of</strong> visceral<br />
adipose tissue induced by HF consumption<br />
(Figure 1C,D). Pr<strong>of</strong>ound dys regulation<br />
in lipid homeo stasis was further observed in<br />
livers <strong>of</strong> HFC-fed rats, which exhibited elevated<br />
levels <strong>of</strong> triacyl glycerol, diacyl glycerol,<br />
and total cholesterol comp<strong>are</strong>d with HF-fed<br />
rats; livers <strong>of</strong> HFR-fed rats tended to exhibit<br />
a reduced lipid accumulation (Figure 1E–G).<br />
Histological examinations highlighted the<br />
development <strong>of</strong> severe hepatosteatosis in rats<br />
fed HFC (Figure 1H) and confirmed that the<br />
presence <strong>of</strong> POPs in salmon oil provokes significant<br />
impairment <strong>of</strong> lipid metabolism.<br />
To gain further insight into the phenotypical<br />
changes <strong>of</strong> animals exposed to POPs,<br />
we performed a comparison <strong>of</strong> gene expression<br />
pr<strong>of</strong>iles in the liver <strong>of</strong> rats fed the HFC<br />
and HFR diets, using oligonucleo tide microarrays.<br />
<strong>The</strong> expression <strong>of</strong> genes involved in<br />
drug metabo lism was affected, indicating<br />
dietary POP exposure [Supplemental Material,<br />
Table 3 (doi:10.1289/ehp.0901321)]. We<br />
also observed major differences for genes<br />
involved in lipid metabo lism and for several<br />
genes linked to lipid deposition (Supplemental<br />
Material, Table 3). Of interest, POPs induced<br />
robust down-regulation <strong>of</strong> insulin-induced<br />
gene-1 (Insig-1) and Lpin1, two master regulators<br />
<strong>of</strong> lipo genesis and synthesis <strong>of</strong> triglyceride<br />
and cholesterol (Croce et al. 2007;<br />
Engelking et al. 2004; Finck et al. 2006; Lee<br />
and Ye 2004). Real-time PCR analysis confirmed<br />
the strong repression <strong>of</strong> Lpin 1 and<br />
Insig-1 genes in the liver <strong>of</strong> rats consuming the<br />
HFC diet (Table 1). Similarly, in adipose tissue<br />
<strong>of</strong> HFC-fed rats, expression <strong>of</strong> Lpin1 and<br />
Insig-1 genes was repressed comp<strong>are</strong>d with<br />
466 v o l u m e 118 | number 4 | April 2010 • Environmental Health Perspectives