Cyclooxygenases and UCP1 PLoS ONE | www.plosone.org 8 June 2010 | Volume 5 | Issue 6 | e11391
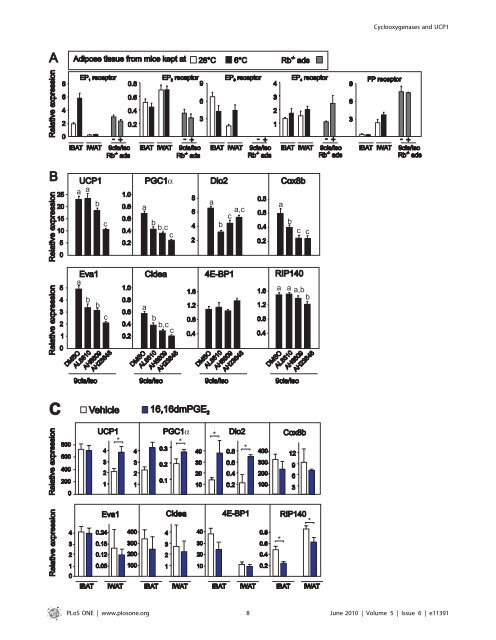
Cyclooxygenases and UCP1 Figure 6. UCP1 expression is attenuated by an EP 4 receptor antagonist in Rb 2/2 adipocytes and induced by the EP4 receptor agonist 16,16dmPGE 2 in vivo. A.Expressions <strong>of</strong> EP 1 ,EP 2 ,EP 3 ,EP 4 and FP receptors were measured by RT-qPCR in iBAT and iWAT isolated from warm- and cold-acclimated mice, and in Rb 2/2 adipocytes treated with vehicle or isoproterenol (100 nM) and 9-cis-retinoic acid (1 mM). B. Rb 2/2 adipocytes were treated with vehicle or isoproterenol (100 nM) and 9-cis-retinoic acid (1 mM) by RT-qPCR in absence and presence <strong>of</strong> AL8810, AH6809, or AH23848, which <strong>are</strong> FP, EP 1 /EP 2 and EP 4 receptor antagonists, respectively. Expressions <strong>of</strong> genes were measured by RT-qPCR. <strong>The</strong> bars represent mean 6 standard error. Different letters indicate statistically significant differences (p,0.05). C. C57BL/6J mice were subcutaneously injected with vehicle or 16,16dmPGE 2 (50 mM/kg) every 12 h for 48 h. Expressions <strong>of</strong> genes were measured by RT-qPCR. <strong>The</strong> bars represent mean 6 standard error (n = 5). * indicates statistical significant difference between vehicle and 16,16 dmPGE 2 treated mice (p,0.05). doi:10.1371/journal.pone.0011391.g006 mice. Also, injection <strong>of</strong> a stable analog <strong>of</strong> the COX2 downstream product PGE 2 , 16,16-dimethyl-PGE 2 , induced UCP1 expression in iWAT. Forced expression <strong>of</strong> COX2, alone or in combination with COX1, induced UCP1 expression in a cell model resembling inguinal adipocytes. Finally, the inhibition <strong>of</strong> COX activity not only attenuated diet-induced UCP1 expression in iWAT, but also increased weight gain in Sv129 mice kept at thermoneutrality. <strong>The</strong> association between diet-induced thermogenesis and the recruitment <strong>of</strong> brown adipose tissue was first noted more than 30 years ago and believed to involve the classical brown adipose tissue located in the interscapular region [59]. <strong>The</strong> anti-obesity role <strong>of</strong> UCP1 was challenged by the finding that UCP1 KO mice were not obese [60]. However, the recent demonstration that UCP1 ablation per se induced obesity when the mice were kept at thermoneutrality [61] clearly indicates that UCP1 is important in diet-induced energy dissipation at thermoneutrality. Our data indicate that inhibition <strong>of</strong> COX activity increased weight gain and concomitantly attenuated diet-induced UCP1 expression in iWAT, but not iBAT in Sv129 mice kept at thermoneutrality, pointing to a novel role <strong>of</strong> COX activity in the control <strong>of</strong> energy balance and the development <strong>of</strong> obesity. <strong>The</strong>se results <strong>are</strong> in line with our earlier observation that enhanced cAMP signaling in response to an increased glucagon/insulin ratio led to an increased COX-mediated PGE 2 production. This was accompanied by increased expression <strong>of</strong> UCP1 in iWAT, but not in iBAT, and decreased feed efficiency [62]. Although neither COX1 KO nor COX2 KO mice <strong>are</strong> obese, COX2 +/2 KO mice have more adipose tissue than wild-type littermates when fed an <strong>obesogenic</strong> diet [48]. <strong>The</strong> reason why COX2 +/2 , but not COX2 KO mice were reported to be prone to obesity is not clear. However, these studies were not performed at thermoneutrality [48]. A similar phenomenon is actually seen in GLUT4 KO mice, where the majority <strong>of</strong> GLUT4 2/+ , but not GLUT4 2/2 mice develops diabetes [63]. Moreover, release <strong>of</strong> PGE 2 from adipose tissue in COX2 +/2 mice was reported to be reduced comp<strong>are</strong>d to adipose tissue from wild-type mice [48] and adipose tissue cultures obtained from obese rats have lower PGE 2 release rates than cultures from lean rats [38]. In addition, microsomal prostaglandin α Figure 7. Indomethacin prevents high-fat diet-induced UCP1 expression in iWAT but not iBAT in the obesity-resistant Sv129 mouse strain. Mice were fed a very high-fat diet (VHF) with or without indomethacin supplementation (16 ppm) for 4 weeks at a temperature <strong>of</strong> 28–30uC. One group <strong>of</strong> mice was killed before the experiment started. A. Body weight gain and energy intake relative to body weight gain. B. Different adipose tissue depots were dissected and weighed. C and D. Representative paraffin-embedded representative sections from iWAT and iBAT were stained with hematoxylin and eosin. <strong>The</strong> scale bars represent 50 mM. E. Expressions <strong>of</strong> genes in iWAT and iBAT were measured by RT-qPCR. <strong>The</strong> bars represent mean 6 standard error (n = 6). * indicates statistical significant difference (p,0.05) between different groups. doi:10.1371/journal.pone.0011391.g007 PLoS ONE | www.plosone.org 9 June 2010 | Volume 5 | Issue 6 | e11391
- Page 1 and 2:
The obesogenic effects of polyunsat
- Page 3 and 4:
Table of Contents Acknowledgement .
- Page 5 and 6:
Abstract in Danish Polyumættede n-
- Page 7 and 8:
Polyunsaturated fatty acids in the
- Page 9 and 10:
was more than 3 times higher in the
- Page 11 and 12:
gluconeogenesis and ureagenesis (Fi
- Page 13 and 14:
high dietary PUFAs, the modulation
- Page 15 and 16:
In a pair of population studies, an
- Page 17 and 18:
18. Massiera, F. et al. Arachidonic
- Page 19 and 20:
54. Xu, J. et al. Polyunsaturated f
- Page 21 and 22:
Annexes 1. Ma T, Liaset B, Hao Q, P
- Page 23 and 24:
Fish Oil, Sucrose and Obesity Obesi
- Page 25 and 26:
Fish Oil, Sucrose and Obesity Figur
- Page 27 and 28:
Fish Oil, Sucrose and Obesity Table
- Page 29 and 30: Fish Oil, Sucrose and Obesity Figur
- Page 31 and 32: Fish Oil, Sucrose and Obesity Figur
- Page 33 and 34: Fish Oil, Sucrose and Obesity 6. Ma
- Page 35 and 36: Carbohydrate source and insulin sec
- Page 37 and 38: 20 21 22 23 24 25 26 27 28 29 30 31
- Page 39 and 40: 68 69 70 71 72 73 74 75 76 77 78 79
- Page 41 and 42: 114 115 116 117 118 119 120 121 122
- Page 43 and 44: 160 161 162 163 164 165 166 167 168
- Page 45 and 46: 208 209 210 211 212 213 214 215 216
- Page 47 and 48: 256 257 258 259 260 261 262 263 264
- Page 49 and 50: 302 303 304 305 306 307 308 309 310
- Page 51 and 52: 350 351 FIGURE LEGENDS 352 353 354
- Page 53 and 54: 398 399 400 401 402 403 404 subunit
- Page 55 and 56: 446 447 448 449 450 451 gamma, coac
- Page 57 and 58: 484 485 486 TABLE 1. Macronutrient
- Page 59 and 60: Energy (kJ/g) 17.16 25.12 25.12 25.
- Page 61 and 62: 561 562 563 564 565 566 567 568 569
- Page 63 and 64: 635 636 637 638 639 640 641 642 643
- Page 65: 711 712 713 714 715 716 717 718 719
- Page 74 and 75: Cyclooxygenases and UCP1 Although i
- Page 76 and 77: Cyclooxygenases and UCP1 Figure 2.
- Page 78 and 79: Cyclooxygenases and UCP1 Figure 4.
- Page 82 and 83: Cyclooxygenases and UCP1 E synthase
- Page 84 and 85: Cyclooxygenases and UCP1 29. Granne
- Page 86 and 87: JBC Papers in Press. Published on J
- Page 88 and 89: hydrolysate (SPH), would be protect
- Page 90 and 91: was used as the liver cytosolic fra
- Page 92 and 93: In order to demonstrate that bile a
- Page 94 and 95: Nutritional regulation of endogenou
- Page 96 and 97: in increased whole body energy expe
- Page 98 and 99: 38. Kanehisa M, and Goto S. (2000)
- Page 100 and 101: FOOTNOTES This work was carried out
- Page 102 and 103: fed the same diets, plus the SPH-di
- Page 104 and 105: Figure 2 A nmol/ min/ mg prot 2,4 1
- Page 106 and 107: Figure 4 A 6 Liver Pparα B 21 Live
- Page 108 and 109: Figure 7 A Plasma ALAT B Liver Ucp2
- Page 110 and 111: Ruzzin et al. investigated the meta
- Page 112 and 113: Ruzzin et al. CD14, and rho kinases
- Page 114 and 115: Ruzzin et al. salmon oil induced a