The obesogenic effects of polyunsaturated fatty acids are dependent ...
The obesogenic effects of polyunsaturated fatty acids are dependent ...
The obesogenic effects of polyunsaturated fatty acids are dependent ...

Create successful ePaper yourself
Turn your PDF publications into a flip-book with our unique Google optimized e-Paper software.
Ruzzin et al.<br />
CD14, and rho kinases in regulating insulin<br />
signaling and establishment <strong>of</strong> insulin resistance<br />
in response to chronic low-grade inflammation<br />
<strong>are</strong> well documented (Begum et al.<br />
2002; Cani et al. 2007; Furukawa et al. 2005;<br />
Petersen et al. 2008; Tzivion et al. 2001).<br />
Effects <strong>of</strong> POPs on insulin action in vivo.<br />
Next, we assessed the impacts <strong>of</strong> POPs on<br />
whole-body insulin action. In the basal state,<br />
intake <strong>of</strong> the HFC diet exacerbated the hyperinsulinemia<br />
induced by HF consumption,<br />
whereas animals fed HFR and control diets<br />
had similar plasma insulin levels (Figure 2A).<br />
Basal plasma glucose levels were similar in<br />
all groups (Figure 2B), but the HOMA-IR<br />
index was significantly increased in rats fed<br />
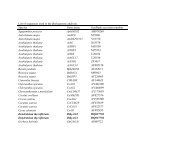
Table 1. Real-time PCR determination <strong>of</strong> mRNA expression <strong>of</strong> a set <strong>of</strong> relevant genes in the liver <strong>of</strong> rats<br />
fed HFR or HFC diets (n = 9 per group).<br />
HFR HFC p-Value<br />
Genes related to mitochondrial function<br />
PGC1α 0.73 ± 0.3 0.05 ± 0.02 0.043<br />
PPARα (peroxisome proliferator-activated receptor α) 76 ± 7 75 ± 18 0.988<br />
CS (citrate synthase) 316 ± 19 214 ± 10 0.002<br />
SDHA (succinate dehydrogenase) 74 ± 2 63 ± 4 0.038<br />
MCAD (medium chain acyl CoA dehydrogenase) 332 ± 30 170 ± 18 0.003<br />
Genes related to lipogenesis<br />
SREBP1C 3.0 ± 0.3 4.6 ± 0.6 0.021<br />
LXRα 50 ± 3 51 ± 7 0.932<br />
FAS 1.1 ± 0.1 1.9 ± 0.2 0.01<br />
Lpin 1 96 ± 17 22 ± 10 0.0017<br />
Insig-1 123 ± 23 43 ± 12 0.0071<br />
Plasma insulin<br />
(ng/mL)<br />
GIR<br />
(mg/kg/min)<br />
Clamp HGP<br />
(mg/kg/min)<br />
Glucose uptake<br />
(mmol/kg ww/30 min)<br />
3<br />
2<br />
1<br />
0<br />
15<br />
10<br />
5<br />
0<br />
15<br />
10<br />
5<br />
0<br />
5<br />
4<br />
3<br />
2<br />
1<br />
0<br />
*<br />
#<br />
#<br />
**<br />
##<br />
0 2,000<br />
#<br />
Insulin (µU/mL)<br />
#<br />
Chow<br />
HF<br />
HFR<br />
HFC<br />
#<br />
Plasma glucose<br />
(mg/dL)<br />
Basal HGP<br />
(mg/kg/min)<br />
Clamp R d<br />
(mg/kg/min)<br />
Glucose uptake<br />
(fmoL/1,000 cells/min)<br />
Figure 2. Effects <strong>of</strong> salmon oil and POPs on insulin action and glucose metabolism evaluated by hyperinsulinemic–euglycemic<br />
clamps performed in rats fed chow or HF, HFR, or HFC diets over a 4-week period.<br />
(A) Basal insulinemia. (B) Basal glycemia. (C) GIR. (D) Basal HGP. (E) HGP during the clamps. (F) Glucose<br />
disposal rate (R d ). (G) Insulin-stimulated glucose uptake in soleus muscles. (H) Insulin-stimulated glucose<br />
uptake in primary adipocytes. All data <strong>are</strong> shown as mean ± SE; n = 6–9.<br />
*p < 0.04 comp<strong>are</strong>d with chow control. **p < 0.04 comp<strong>are</strong>d with HF. # p < 0.05 comp<strong>are</strong>d with HFR. ## p < 0.03 comp<strong>are</strong>d<br />
with HF.<br />
160<br />
120<br />
80<br />
40<br />
0<br />
15<br />
10<br />
5<br />
0<br />
15<br />
10<br />
5<br />
0<br />
8<br />
6<br />
4<br />
2<br />
0<br />
0<br />
#<br />
Insulin (µU/mL)<br />
2,000<br />
##<br />
the HFC diet (7.1 for control rats, 11.2 for<br />
rats fed HF, 8.4 for rats fed HFR, and 15.5<br />
for rats fed HFC; p < 0.04).<br />
<strong>The</strong> performance <strong>of</strong> hyperinsulinemic–<br />
euglycemic clamp, the gold standard for<br />
investigating and quantifying insulin resistance<br />
(Kraegen et al. 1983), revealed that the<br />
consumption <strong>of</strong> the HFC diet aggravated<br />
HF-induced reduced GIR, whereas HFR-fed<br />
rats showed no impairment <strong>of</strong> insulin action<br />
comp<strong>are</strong>d with control rats (Figure 2C).<br />
Reduced GIR reflects decreased insulinmediated<br />
suppression <strong>of</strong> HGP, reduced insulinstimulated<br />
peripheral glucose disposal rates,<br />
or both. Analysis <strong>of</strong> these parameters revealed<br />
that basal HGP was similar in all groups<br />
(Figure 2D), whereas suppression <strong>of</strong> HGP<br />
by insulin was impaired in animals consuming<br />
both HFC and HF diets (Figure 2E).<br />
Moreover, intake <strong>of</strong> HFC led to impaired<br />
insulin-mediated glucose disposal in peripheral<br />
tissues, which mainly include skeletal muscles<br />
and adipose tissue (Figure 2F). To investigate<br />
this further, we determined the rates <strong>of</strong> glucose<br />
uptake in isolated soleus muscles and primary<br />
adipocytes. We found that insulin-stimulated<br />
glucose uptake was reduced to a similar extent<br />
in skeletal muscle <strong>of</strong> animals fed HFC and<br />
HF diets (Figure 2G). In contrast, rats fed<br />
the HFR diet were protected against muscle<br />
insulin resistance (Figure 2G). In adipose tissue,<br />
the ability <strong>of</strong> insulin to stimulate glucose<br />
uptake was impaired in both the HFR and HF<br />
groups, and this metabolic defect was worsened<br />
by the consumption <strong>of</strong> the HFC diet<br />
(Figure 2H). Thus, exposure to POPs present<br />
in HFC exacerbated the deleterious metabolic<br />
<strong>effects</strong> <strong>of</strong> HF and attenuated the protective<br />
<strong>effects</strong> <strong>of</strong> n-3 <strong>polyunsaturated</strong> <strong>fatty</strong> <strong>acids</strong>,<br />
which indicates that the presence <strong>of</strong> environmental<br />
organic contaminants may influence<br />
the outcomes <strong>of</strong> food and dietary products.<br />
<strong>The</strong>re is growing evidence that mitochondrial<br />
dysfunction contributes to insulin resistance<br />
(Lowell and Shulman 2005). To assess<br />
the impact <strong>of</strong> POPs on hepatic mitochondrial<br />
content, we measured mitochondrial<br />
DNA levels by quantitative polymerase chain<br />
reaction (qPCR), using primers specific for<br />
the COXII gene, and determined the ratio<br />
between mitochondrial DNA and nuclear<br />
DNA as previously validated (Bonnard et al.<br />
2008). We found no app<strong>are</strong>nt modification<br />
<strong>of</strong> the amount <strong>of</strong> mitochondrial DNA in the<br />
liver <strong>of</strong> the animals fed HFC (ratio COXII/<br />
PPIA, 1.1 ± 0.2 (mean ± SE) for rats fed HFR<br />
and 0.9 ± 0.1 for rats fed HFC, p = 0.189).<br />
However, despite this app<strong>are</strong>nt lack <strong>of</strong> change<br />
in mitochondrial content, we observed significant<br />
reduction in the expression <strong>of</strong> several<br />
genes related to mitochondrial function,<br />
such as PGC1α (peroxisome proliferatoractivated<br />
receptor gamma-coactivator-1<br />
alpha), citrate synthase, medium-chain acyl<br />
468 v o l u m e 118 | number 4 | April 2010 • Environmental Health Perspectives