The obesogenic effects of polyunsaturated fatty acids are dependent ...
The obesogenic effects of polyunsaturated fatty acids are dependent ...
The obesogenic effects of polyunsaturated fatty acids are dependent ...

You also want an ePaper? Increase the reach of your titles
YUMPU automatically turns print PDFs into web optimized ePapers that Google loves.
91<br />
92<br />
93<br />
94<br />
95<br />
96<br />
97<br />
98<br />
99<br />
100<br />
101<br />
102<br />
103<br />
104<br />
105<br />
106<br />
107<br />
108<br />
109<br />
110<br />
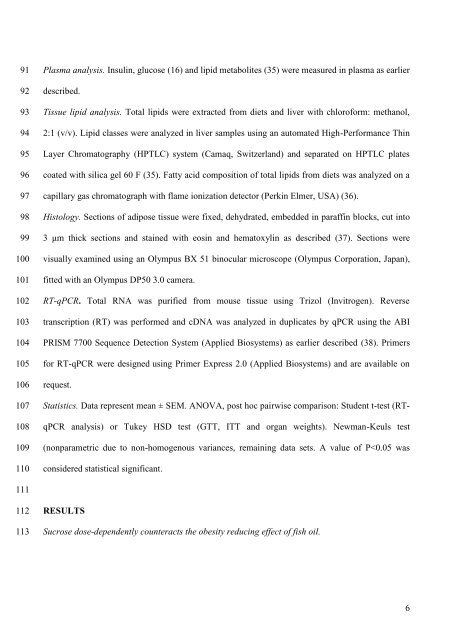
Plasma analysis. Insulin, glucose (16) and lipid metabolites (35) were measured in plasma as earlier<br />
described.<br />
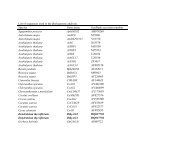
Tissue lipid analysis. Total lipids were extracted from diets and liver with chlor<strong>of</strong>orm: methanol,<br />
2:1 (v/v). Lipid classes were analyzed in liver samples using an automated High-Performance Thin<br />
Layer Chromatography (HPTLC) system (Camaq, Switzerland) and separated on HPTLC plates<br />
coated with silica gel 60 F (35). Fatty acid composition <strong>of</strong> total lipids from diets was analyzed on a<br />
capillary gas chromatograph with flame ionization detector (Perkin Elmer, USA) (36).<br />
Histology. Sections <strong>of</strong> adipose tissue were fixed, dehydrated, embedded in paraffin blocks, cut into<br />
3 μm thick sections and stained with eosin and hematoxylin as described (37). Sections were<br />
visually examined using an Olympus BX 51 binocular microscope (Olympus Corporation, Japan),<br />
fitted with an Olympus DP50 3.0 camera.<br />
RT-qPCR. Total RNA was purified from mouse tissue using Trizol (Invitrogen). Reverse<br />
transcription (RT) was performed and cDNA was analyzed in duplicates by qPCR using the ABI<br />
PRISM 7700 Sequence Detection System (Applied Biosystems) as earlier described (38). Primers<br />
for RT-qPCR were designed using Primer Express 2.0 (Applied Biosystems) and <strong>are</strong> available on<br />
request.<br />
Statistics. Data represent mean ± SEM. ANOVA, post hoc pairwise comparison: Student t-test (RTqPCR<br />
analysis) or Tukey HSD test (GTT, ITT and organ weights). Newman-Keuls test<br />
(nonparametric due to non-homogenous variances, remaining data sets. A value <strong>of</strong> P