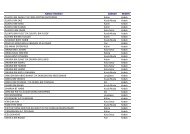
Contents - SPAD
Contents - SPAD
Contents - SPAD

You also want an ePaper? Increase the reach of your titles
YUMPU automatically turns print PDFs into web optimized ePapers that Google loves.
Integration between different LPT modes and between bus services can be described as sporadic<br />
across the region. In the central areas, where existing rail services are provided, bus to rail<br />
integration and the connectivity it provides is achieved with relative success but this is much less<br />
evident elsewhere. Whilst significant improvements in seamless interchange have been achieved<br />
through recent ticketing initiatives, the promotion of integration between modes remains generally<br />
poor. This will remain so whilst bus operators fail to publish timetables and route information in<br />
sufficient detail for passengers to plan their travel in confidence.<br />
Thus a general conclusion can be reached that there are significant gaps in the levels of bus<br />
services currently provided. These need to be addressed through the development of localised bus<br />
service networks that would also act as a feeder bus service network to meet the growing demands<br />
of the region and the emerging enhanced rail network including the MRT system.<br />
The following three diagrams present an analysis of gaps in the provision of LPT and where feeder<br />
bus networks can be developed to support the rail based level of the integrated LPT hierarchy.<br />
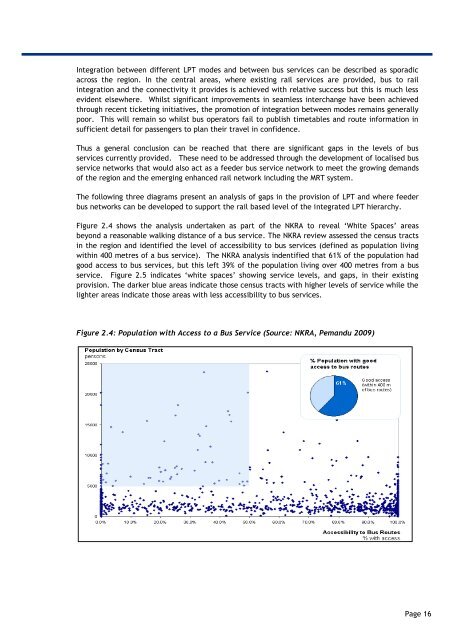
Figure 2.4 shows the analysis undertaken as part of the NKRA to reveal „White Spaces‟ areas<br />
beyond a reasonable walking distance of a bus service. The NKRA review assessed the census tracts<br />
in the region and identified the level of accessibility to bus services (defined as population living<br />
within 400 metres of a bus service). The NKRA analysis indentified that 61% of the population had<br />
good access to bus services, but this left 39% of the population living over 400 metres from a bus<br />
service. Figure 2.5 indicates „white spaces‟ showing service levels, and gaps, in their existing<br />
provision. The darker blue areas indicate those census tracts with higher levels of service while the<br />
lighter areas indicate those areas with less accessibility to bus services.<br />
Figure 2.4: Population with Access to a Bus Service (Source: NKRA, Pemandu 2009)<br />
Page 16