Contents - SPAD
Contents - SPAD
Contents - SPAD

Create successful ePaper yourself
Turn your PDF publications into a flip-book with our unique Google optimized e-Paper software.
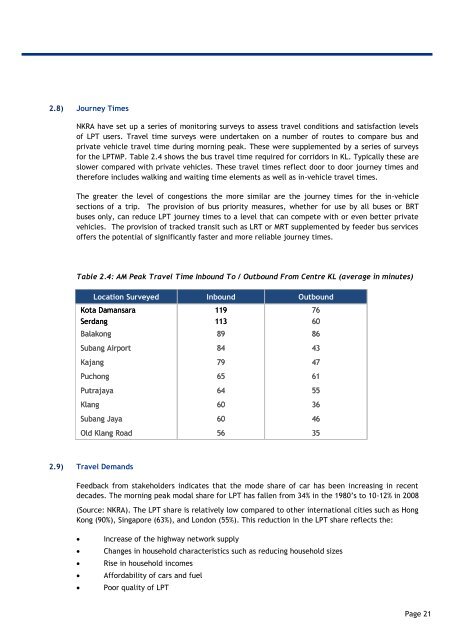
2.8) Journey Times<br />
NKRA have set up a series of monitoring surveys to assess travel conditions and satisfaction levels<br />
of LPT users. Travel time surveys were undertaken on a number of routes to compare bus and<br />
private vehicle travel time during morning peak. These were supplemented by a series of surveys<br />
for the LPTMP. Table 2.4 shows the bus travel time required for corridors in KL. Typically these are<br />
slower compared with private vehicles. These travel times reflect door to door journey times and<br />
therefore includes walking and waiting time elements as well as in-vehicle travel times.<br />
The greater the level of congestions the more similar are the journey times for the in-vehicle<br />
sections of a trip. The provision of bus priority measures, whether for use by all buses or BRT<br />
buses only, can reduce LPT journey times to a level that can compete with or even better private<br />
vehicles. The provision of tracked transit such as LRT or MRT supplemented by feeder bus services<br />
offers the potential of significantly faster and more reliable journey times.<br />
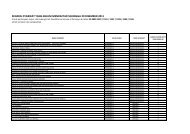
Table 2.4: AM Peak Travel Time Inbound To / Outbound From Centre KL (average in minutes)<br />
Location Surveyed Inbound Outbound<br />
Kota Damansara 119 76<br />
Serdang 113 60<br />
Balakong 89 86<br />
Subang Airport 84 43<br />
Kajang 79 47<br />
Puchong 65 61<br />
Putrajaya 64 55<br />
Klang 60 36<br />
Subang Jaya 60 46<br />
Old Klang Road 56 35<br />
2.9) Travel Demands<br />
Feedback from stakeholders indicates that the mode share of car has been increasing in recent<br />
decades. The morning peak modal share for LPT has fallen from 34% in the 1980‟s to 10-12% in 2008<br />
(Source: NKRA). The LPT share is relatively low compared to other international cities such as Hong<br />
Kong (90%), Singapore (63%), and London (55%). This reduction in the LPT share reflects the:<br />
<br />
<br />
<br />
<br />
<br />
Increase of the highway network supply<br />
Changes in household characteristics such as reducing household sizes<br />
Rise in household incomes<br />
Affordability of cars and fuel<br />
Poor quality of LPT<br />
Page 21