Contents - SPAD
Contents - SPAD
Contents - SPAD

Create successful ePaper yourself
Turn your PDF publications into a flip-book with our unique Google optimized e-Paper software.
Stakeholder‟s plans and proposals for the future<br />
Range of data (land use information, bus network data, traffic counts and journey time<br />
data).<br />
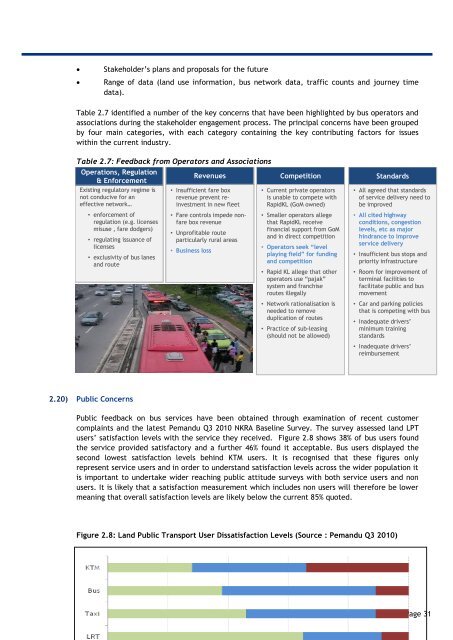
Table 2.7 identified a number of the key concerns that have been highlighted by bus operators and<br />
associations during the stakeholder engagement process. The principal concerns have been grouped<br />
by four main categories, with each category containing the key contributing factors for issues<br />
within the current industry.<br />
Table 2.7: Feedback from Operators and Associations<br />
Operations, Regulation<br />
& Enforcement<br />
Existing regulatory regime is<br />
not conducive for an<br />
effective network…<br />
• enforcement of<br />
regulation (e.g. licenses<br />
misuse , fare dodgers)<br />
• regulating issuance of<br />
licenses<br />
• exclusivity of bus lanes<br />
and route<br />
Revenues<br />
Competition<br />
• Insufficient fare box<br />
revenue prevent reinvestment<br />
in new fleet<br />
• Fare controls impede nonfare<br />
box revenue<br />
• Unprofitable route<br />
particularly rural areas<br />
• Business loss<br />
• Current private operators<br />
is unable to compete with<br />
RapidKL (GoM owned)<br />
• Smaller operators allege<br />
that RapidKL receive<br />
financial support from GoM<br />
and in direct competition<br />
• Operators seek “level<br />
playing field” for funding<br />
and competition<br />
• Rapid KL allege that other<br />
operators use “pajak”<br />
system and franchise<br />
routes illegally<br />
• Network rationalisation is<br />
needed to remove<br />
duplication of routes<br />
• Practice of sub-leasing<br />
(should not be allowed)<br />
Standards<br />
• All agreed that standards<br />
of service delivery need to<br />
be improved<br />
• All cited highway<br />
conditions, congestion<br />
levels, etc as major<br />
hindrance to improve<br />
service delivery<br />
• Insufficient bus stops and<br />
priority infrastructure<br />
• Room for improvement of<br />
terminal facilities to<br />
facilitate public and bus<br />
movement<br />
• Car and parking policies<br />
that is competing with bus<br />
• Inadequate drivers‟<br />
minimum training<br />
standards<br />
• Inadequate drivers‟<br />
reimbursement<br />
2.20) Public Concerns<br />
Public feedback on bus services have been obtained through examination of recent customer<br />
complaints and the latest Pemandu Q3 2010 NKRA Baseline Survey. The survey assessed land LPT<br />
users‟ satisfaction levels with the service they received. Figure 2.8 shows 38% of bus users found<br />
the service provided satisfactory and a further 46% found it acceptable. Bus users displayed the<br />
second lowest satisfaction levels behind KTM users. It is recognised that these figures only<br />
represent service users and in order to understand satisfaction levels across the wider population it<br />
is important to undertake wider reaching public attitude surveys with both service users and non<br />
users. It is likely that a satisfaction measurement which includes non users will therefore be lower<br />
meaning that overall satisfaction levels are likely below the current 85% quoted.<br />
Figure 2.8: Land Public Transport User Dissatisfaction Levels (Source : Pemandu Q3 2010)<br />
Page 31