Recommendations - City of West Torrens - SA.Gov.au
Recommendations - City of West Torrens - SA.Gov.au
Recommendations - City of West Torrens - SA.Gov.au

Create successful ePaper yourself
Turn your PDF publications into a flip-book with our unique Google optimized e-Paper software.
4.0<br />
Transport Mode and Employment<br />
In Adelaide, public transport carries<br />
an estimated 10% <strong>of</strong> passenger travel<br />
during peak hours and only 5% <strong>of</strong> all<br />
weekday travel (peak and <strong>of</strong>f-peak). South<br />
Australia’s Strategic Plan identifies a target<br />
to double the use <strong>of</strong> public transport to<br />
10% <strong>of</strong> weekday travel by 2018*.<br />
Within metropolitan Adelaide,<br />
approximately 3.5 million trips are<br />
made each day <strong>of</strong> which 2.7 million<br />
are made by car, 160,000 by public<br />
transport and the remainder by<br />
walking, cycling or other means. Travel<br />
on weekends has been rising with an<br />
average <strong>of</strong> 3.4 million trips*.<br />
*Source <strong>of</strong> information: Adelaide Urban<br />
Corridors Strategy 2006 DTRS and DTEI.<br />
‘ In the <strong>City</strong> <strong>of</strong> <strong>West</strong> <strong>Torrens</strong>,<br />
67 per cent <strong>of</strong> people use a<br />
car to travel to work, 8.1 per<br />
cent use public transport and<br />
4.7 per cent walk or cycle.’<br />
The ABS Census 2001 data shows that<br />
in the <strong>City</strong> <strong>of</strong> <strong>West</strong> <strong>Torrens</strong>, 67% <strong>of</strong><br />
people use a car as their only means<br />
<strong>of</strong> travel to work, 8.1% use public<br />
transport and 4.7% walk or cycle.<br />
The journey to work data for 2001 for<br />
the <strong>City</strong> <strong>of</strong> <strong>West</strong> <strong>Torrens</strong> shows that<br />
24.4% <strong>of</strong> the employed residents <strong>of</strong> the<br />
<strong>City</strong> worked within the Council area.<br />
Of those residents who worked outside<br />
<strong>of</strong> the Council area, the two major areas<br />
are within the <strong>City</strong> <strong>of</strong> Adelaide (24.7%<br />
<strong>of</strong> the employed residents) and within<br />
the <strong>City</strong> <strong>of</strong> Charles Sturt (11.1%).<br />
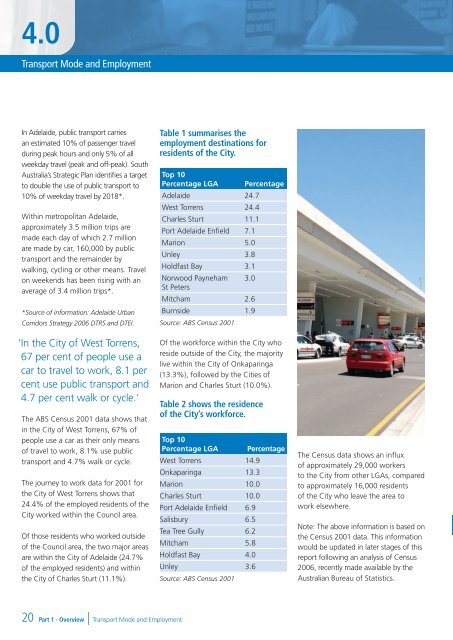
Table 1 summarises the<br />
employment destinations for<br />
residents <strong>of</strong> the <strong>City</strong>.<br />
Top 10<br />
Percentage LGA Percentage<br />
Adelaide 24.7<br />
<strong>West</strong> <strong>Torrens</strong> 24.4<br />
Charles Sturt 11.1<br />
Port Adelaide Enfield 7.1<br />
Marion 5.0<br />
Unley 3.8<br />
Holdfast Bay 3.1<br />
Norwood Payneham 3.0<br />
St Peters<br />
Mitcham 2.6<br />
Burnside 1.9<br />
Source: ABS Census 2001<br />
Of the workforce within the <strong>City</strong> who<br />
reside outside <strong>of</strong> the <strong>City</strong>, the majority<br />
live within the <strong>City</strong> <strong>of</strong> Onkaparinga<br />
(13.3%), followed by the Cities <strong>of</strong><br />
Marion and Charles Sturt (10.0%).<br />
Table 2 shows the residence<br />
<strong>of</strong> the <strong>City</strong>’s workforce.<br />
Top 10<br />
Percentage LGA Percentage<br />
<strong>West</strong> <strong>Torrens</strong> 14.9<br />
Onkaparinga 13.3<br />
Marion 10.0<br />
Charles Sturt 10.0<br />
Port Adelaide Enfield 6.9<br />
Salisbury 6.5<br />
Tea Tree Gully 6.2<br />
Mitcham 5.8<br />
Holdfast Bay 4.0<br />
Unley 3.6<br />
Source: ABS Census 2001<br />
The Census data shows an influx<br />
<strong>of</strong> approximately 29,000 workers<br />
to the <strong>City</strong> from other LGAs, compared<br />
to approximately 16,000 residents<br />
<strong>of</strong> the <strong>City</strong> who leave the area to<br />
work elsewhere.<br />
Note: The above information is based on<br />
the Census 2001 data. This information<br />
would be updated in later stages <strong>of</strong> this<br />
report following an analysis <strong>of</strong> Census<br />
2006, recently made available by the<br />
Australian Bure<strong>au</strong> <strong>of</strong> Statistics.<br />
20<br />
Part 1 - Overview | Transport Mode and Employment