

cot-fy-2013-14
cot-fy-2013-14
cot-fy-2013-14

Create successful ePaper yourself
Turn your PDF publications into a flip-book with our unique Google optimized e-Paper software.
- 89 -<br />
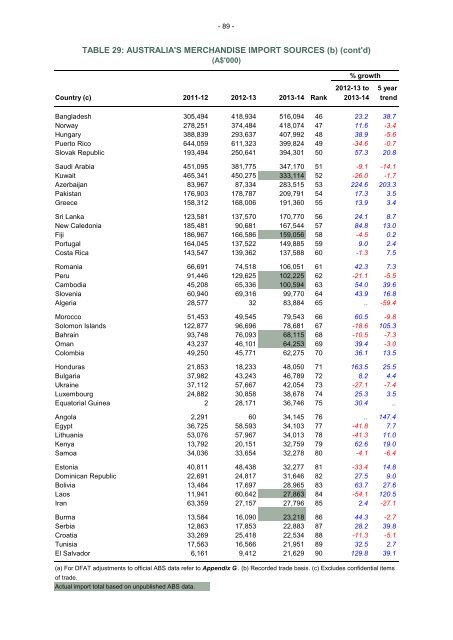
TABLE 29: AUSTRALIA'S MERCHANDISE IMPORT SOURCES (b) (cont'd)<br />
(A$'000)<br />
% growth<br />
2012-13 to 5 year<br />
Country (c) 2011-12 2012-13 <strong>2013</strong>-<strong>14</strong> Rank <strong>2013</strong>-<strong>14</strong> trend<br />
Bangladesh 305,494 418,934 516,094 46 23.2 38.7<br />
Norway 278,251 374,484 418,074 47 11.6 -3.4<br />
Hungary 388,839 293,637 407,992 48 38.9 -5.6<br />
Puerto Rico 644,059 611,323 399,824 49 -34.6 -0.7<br />
Slovak Republic 193,494 250,641 394,301 50 57.3 20.8<br />
Saudi Arabia 451,095 381,775 347,170 51 -9.1 -<strong>14</strong>.1<br />
Kuwait 465,341 450,275 333,1<strong>14</strong> 52 -26.0 -1.7<br />
Azerbaijan 83,967 87,334 283,515 53 224.6 203.3<br />
Pakistan 176,903 178,787 209,791 54 17.3 3.5<br />
Greece 158,312 168,006 191,360 55 13.9 3.4<br />
Sri Lanka 123,581 137,570 170,770 56 24.1 8.7<br />
New Caledonia 185,481 90,681 167,544 57 84.8 13.0<br />
Fiji 186,967 166,586 159,056 58 -4.5 0.2<br />
Portugal 164,045 137,522 <strong>14</strong>9,885 59 9.0 2.4<br />
Costa Rica <strong>14</strong>3,547 139,362 137,588 60 -1.3 7.5<br />
Romania 66,691 74,518 106,051 61 42.3 7.3<br />
Peru 91,446 129,625 102,225 62 -21.1 -5.5<br />
Cambodia 45,208 65,336 100,594 63 54.0 39.6<br />
Slovenia 60,940 69,316 99,770 64 43.9 16.8<br />
Algeria 28,577 32 83,884 65 .. -59.4<br />
Morocco 51,453 49,545 79,543 66 60.5 -9.8<br />
Solomon Islands 122,877 96,696 78,681 67 -18.6 105.3<br />
Bahrain 93,748 76,093 68,115 68 -10.5 -7.3<br />
Oman 43,237 46,101 64,253 69 39.4 -3.0<br />
Colombia 49,250 45,771 62,275 70 36.1 13.5<br />
Honduras 21,853 18,233 48,050 71 163.5 25.5<br />
Bulgaria 37,982 43,243 46,789 72 8.2 4.4<br />
Ukraine 37,112 57,667 42,054 73 -27.1 -7.4<br />
Luxembourg 24,882 30,858 38,678 74 25.3 3.5<br />
Equatorial Guinea 2 28,171 36,746 75 30.4 ..<br />
Angola 2,291 60 34,<strong>14</strong>5 76 .. <strong>14</strong>7.4<br />
Egypt 36,725 58,593 34,103 77 -41.8 7.7<br />
Lithuania 53,076 57,967 34,013 78 -41.3 11.0<br />
Kenya 13,792 20,151 32,759 79 62.6 19.0<br />
Samoa 34,036 33,654 32,278 80 -4.1 -6.4<br />
Estonia 40,811 48,438 32,277 81 -33.4 <strong>14</strong>.8<br />
Dominican Republic 22,691 24,817 31,646 82 27.5 9.0<br />
Bolivia 13,484 17,697 28,965 83 63.7 27.6<br />
Laos 11,941 60,642 27,863 84 -54.1 120.5<br />
Iran 63,359 27,157 27,796 85 2.4 -27.1<br />
Burma 13,584 16,090 23,218 86 44.3 -2.7<br />
Serbia 12,863 17,853 22,883 87 28.2 39.8<br />
Croatia 33,269 25,418 22,534 88 -11.3 -5.1<br />
Tunisia 17,563 16,566 21,951 89 32.5 2.7<br />
El Salvador 6,161 9,412 21,629 90 129.8 39.1<br />
(a) For DFAT adjustments to official ABS data refer to Appendix G . (b) Recorded trade basis. (c) Excludes confidential items<br />
of trade.<br />
Actual import total based on unpublished ABS data.