

cot-fy-2013-14
cot-fy-2013-14
cot-fy-2013-14

You also want an ePaper? Increase the reach of your titles
YUMPU automatically turns print PDFs into web optimized ePapers that Google loves.
- 84 -<br />
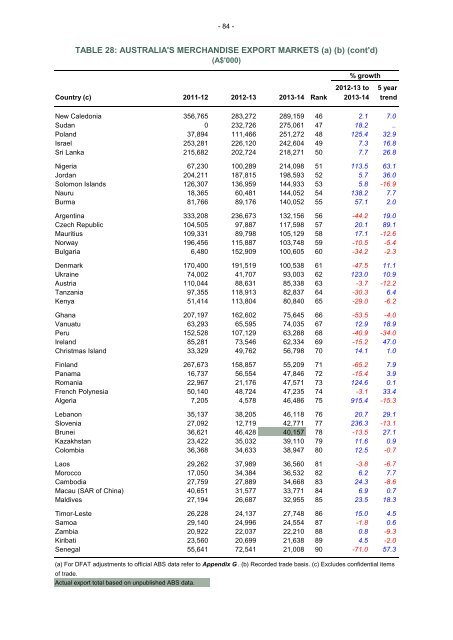
TABLE 28: AUSTRALIA'S MERCHANDISE EXPORT MARKETS (a) (b) (cont'd)<br />
(A$'000)<br />
2012-13 to 5 year<br />
Country (c) 2011-12 2012-13 <strong>2013</strong>-<strong>14</strong> Rank <strong>2013</strong>-<strong>14</strong> trend<br />
New Caledonia 356,765 283,272 289,159 46 2.1 7.0<br />
Sudan 0 232,726 275,061 47 18.2 ..<br />
Poland 37,894 111,466 251,272 48 125.4 32.9<br />
Israel 253,281 226,120 242,604 49 7.3 16.8<br />
Sri Lanka 215,682 202,724 218,271 50 7.7 26.8<br />
Nigeria 67,230 100,289 2<strong>14</strong>,098 51 113.5 63.1<br />
Jordan 204,211 187,815 198,593 52 5.7 36.0<br />
Solomon Islands 126,307 136,959 <strong>14</strong>4,933 53 5.8 -16.9<br />
Nauru 18,365 60,481 <strong>14</strong>4,052 54 138.2 7.7<br />
Burma 81,766 89,176 <strong>14</strong>0,052 55 57.1 2.0<br />
Argentina 333,208 236,673 132,156 56 -44.2 19.0<br />
Czech Republic 104,505 97,887 117,598 57 20.1 89.1<br />
Mauritius 109,331 89,798 105,129 58 17.1 -12.6<br />
Norway 196,456 115,887 103,748 59 -10.5 -5.4<br />
Bulgaria 6,480 152,909 100,605 60 -34.2 -2.3<br />
Denmark 170,400 191,519 100,538 61 -47.5 11.1<br />
Ukraine 74,002 41,707 93,003 62 123.0 10.9<br />
Austria 110,044 88,631 85,338 63 -3.7 -12.2<br />
Tanzania 97,355 118,913 82,837 64 -30.3 6.4<br />
Kenya 51,4<strong>14</strong> 113,804 80,840 65 -29.0 -6.2<br />
Ghana 207,197 162,602 75,645 66 -53.5 -4.0<br />
Vanuatu 63,293 65,595 74,035 67 12.9 18.9<br />
Peru 152,528 107,129 63,288 68 -40.9 -34.0<br />
Ireland 85,281 73,546 62,334 69 -15.2 47.0<br />
Christmas Island 33,329 49,762 56,798 70 <strong>14</strong>.1 1.0<br />
Finland 267,673 158,857 55,209 71 -65.2 7.9<br />
Panama 16,737 56,554 47,846 72 -15.4 3.9<br />
Romania 22,967 21,176 47,571 73 124.6 0.1<br />
French Polynesia 50,<strong>14</strong>0 48,724 47,235 74 -3.1 33.4<br />
Algeria 7,205 4,578 46,486 75 915.4 -15.3<br />
Lebanon 35,137 38,205 46,118 76 20.7 29.1<br />
Slovenia 27,092 12,719 42,771 77 236.3 -13.1<br />
Brunei 36,621 46,428 40,157 78 -13.5 27.1<br />
Kazakhstan 23,422 35,032 39,110 79 11.6 0.9<br />
Colombia 36,368 34,633 38,947 80 12.5 -0.7<br />
Laos 29,262 37,989 36,560 81 -3.8 -6.7<br />
Morocco 17,050 34,384 36,532 82 6.2 7.7<br />
Cambodia 27,759 27,889 34,668 83 24.3 -8.6<br />
Macau (SAR of China) 40,651 31,577 33,771 84 6.9 0.7<br />
Maldives 27,194 26,687 32,955 85 23.5 18.3<br />
Timor-Leste 26,228 24,137 27,748 86 15.0 4.5<br />
Samoa 29,<strong>14</strong>0 24,996 24,554 87 -1.8 0.6<br />
Zambia 20,922 22,037 22,210 88 0.8 -9.3<br />
Kiribati 23,560 20,699 21,638 89 4.5 -2.0<br />
Senegal 55,641 72,541 21,008 90 -71.0 57.3<br />
(a) For DFAT adjustments to official ABS data refer to Appendix G . (b) Recorded trade basis. (c) Excludes confidential items<br />
of trade.<br />
Actual export total based on unpublished ABS data.<br />
% growth