

cot-fy-2013-14
cot-fy-2013-14
cot-fy-2013-14

You also want an ePaper? Increase the reach of your titles
YUMPU automatically turns print PDFs into web optimized ePapers that Google loves.
- 93 -<br />
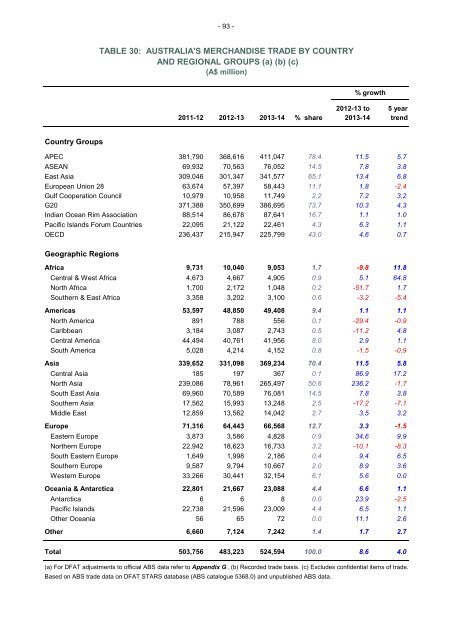
TABLE 30: AUSTRALIA'S MERCHANDISE TRADE BY COUNTRY<br />
AND REGIONAL GROUPS (a) (b) (c)<br />
(A$ million)<br />
% growth<br />
2012-13 to 5 year<br />
2011-12 2012-13 <strong>2013</strong>-<strong>14</strong> % share <strong>2013</strong>-<strong>14</strong> trend<br />
Country Groups<br />
APEC 381,790 368,616 411,047 78.4 11.5 5.7<br />
ASEAN 69,932 70,563 76,052 <strong>14</strong>.5 7.8 3.8<br />
East Asia 309,046 301,347 341,577 65.1 13.4 6.8<br />
European Union 28 63,674 57,397 58,443 11.1 1.8 -2.4<br />
Gulf Cooperation Council 10,979 10,958 11,749 2.2 7.2 3.2<br />
G20 371,388 350,699 386,695 73.7 10.3 4.3<br />
Indian Ocean Rim Association 88,5<strong>14</strong> 86,678 87,641 16.7 1.1 1.0<br />
Pacific Islands Forum Countries 22,095 21,122 22,461 4.3 6.3 1.1<br />
OECD 236,437 215,947 225,799 43.0 4.6 0.7<br />
Geographic Regions<br />
Africa 9,731 10,040 9,053 1.7 -9.8 11.8<br />
Central & West Africa 4,673 4,667 4,905 0.9 5.1 64.8<br />
North Africa 1,700 2,172 1,048 0.2 -51.7 1.7<br />
Southern & East Africa 3,358 3,202 3,100 0.6 -3.2 -5.4<br />
Americas 53,597 48,850 49,408 9.4 1.1 1.1<br />
North America 891 788 556 0.1 -29.4 -0.9<br />
Caribbean 3,184 3,087 2,743 0.5 -11.2 4.8<br />
Central America 44,494 40,761 41,956 8.0 2.9 1.1<br />
South America 5,028 4,2<strong>14</strong> 4,152 0.8 -1.5 -0.9<br />
Asia 339,652 331,098 369,234 70.4 11.5 5.8<br />
Central Asia 185 197 367 0.1 86.9 17.2<br />
North Asia 239,086 78,961 265,497 50.6 236.2 -1.7<br />
South East Asia 69,960 70,589 76,081 <strong>14</strong>.5 7.8 3.8<br />
Southern Asia 17,562 15,993 13,248 2.5 -17.2 -7.1<br />
Middle East 12,859 13,562 <strong>14</strong>,042 2.7 3.5 3.2<br />
Europe 71,316 64,443 66,568 12.7 3.3 -1.5<br />
Eastern Europe 3,873 3,586 4,828 0.9 34.6 9.9<br />
Northern Europe 22,942 18,623 16,733 3.2 -10.1 -8.3<br />
South Eastern Europe 1,649 1,998 2,186 0.4 9.4 6.5<br />
Southern Europe 9,587 9,794 10,667 2.0 8.9 3.6<br />
Western Europe 33,266 30,441 32,154 6.1 5.6 0.0<br />
Oceania & Antarctica 22,801 21,667 23,088 4.4 6.6 1.1<br />
Antarctica 6 6 8 0.0 23.9 -2.5<br />
Pacific Islands 22,738 21,596 23,009 4.4 6.5 1.1<br />
Other Oceania 56 65 72 0.0 11.1 2.6<br />
Other 6,660 7,124 7,242 1.4 1.7 2.7<br />
Total 503,756 483,223 524,594 100.0 8.6 4.0<br />
(a) For DFAT adjustments to official ABS data refer to Appendix G . (b) Recorded trade basis. (c) Excludes confidential items of trade.<br />
Based on ABS trade data on DFAT STARS database (ABS catalogue 5368.0) and unpublished ABS data.