

cot-fy-2013-14
cot-fy-2013-14
cot-fy-2013-14

You also want an ePaper? Increase the reach of your titles
YUMPU automatically turns print PDFs into web optimized ePapers that Google loves.
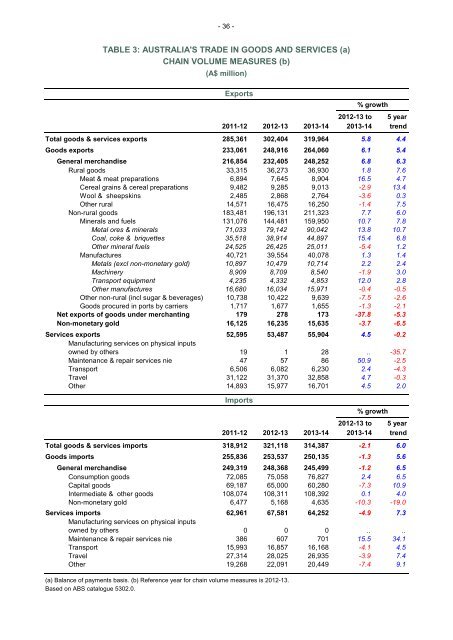
- 36 -<br />
TABLE 3: AUSTRALIA'S TRADE IN GOODS AND SERVICES (a)<br />
CHAIN VOLUME MEASURES (b)<br />
(A$ million)<br />
Exports<br />
2012-13 to 5 year<br />
2011-12 2012-13 <strong>2013</strong>-<strong>14</strong> <strong>2013</strong>-<strong>14</strong> trend<br />
Total goods & services exports 285,361 302,404 319,964 5.8 4.4<br />
Goods exports 233,061 248,916 264,060 6.1 5.4<br />
General merchandise 216,854 232,405 248,252 6.8 6.3<br />
Rural goods 33,315 36,273 36,930 1.8 7.6<br />
Meat & meat preparations 6,894 7,645 8,904 16.5 4.7<br />
Cereal grains & cereal preparations 9,482 9,285 9,013 -2.9 13.4<br />
Wool & sheepskins 2,485 2,868 2,764 -3.6 0.3<br />
Other rural <strong>14</strong>,571 16,475 16,250 -1.4 7.5<br />
Non-rural goods 183,481 196,131 211,323 7.7 6.0<br />
Minerals and fuels 131,076 <strong>14</strong>4,481 159,950 10.7 7.8<br />
Metal ores & minerals 71,033 79,<strong>14</strong>2 90,042 13.8 10.7<br />
Coal, coke & briquettes 35,518 38,9<strong>14</strong> 44,897 15.4 6.8<br />
Other mineral fuels 24,525 26,425 25,011 -5.4 1.2<br />
Manufactures 40,721 39,554 40,078 1.3 1.4<br />
Metals (excl non-monetary gold) 10,897 10,479 10,7<strong>14</strong> 2.2 2.4<br />
Machinery 8,909 8,709 8,540 -1.9 3.0<br />
Transport equipment 4,235 4,332 4,853 12.0 2.8<br />
Other manufactures 16,680 16,034 15,971 -0.4 -0.5<br />
Other non-rural (incl sugar & beverages) 10,738 10,422 9,639 -7.5 -2.6<br />
Goods procured in ports by carriers 1,717 1,677 1,655 -1.3 -2.1<br />
Net exports of goods under merchanting 179 278 173 -37.8 -5.3<br />
Non-monetary gold 16,125 16,235 15,635 -3.7 -6.5<br />
Services exports 52,595 53,487 55,904 4.5 -0.2<br />
Manufacturing services on physical inputs<br />
owned by others 19 1 28 .. -35.7<br />
Maintenance & repair services nie 47 57 86 50.9 -2.5<br />
Transport 6,506 6,082 6,230 2.4 -4.3<br />
Travel 31,122 31,370 32,858 4.7 -0.3<br />
Other <strong>14</strong>,893 15,977 16,701 4.5 2.0<br />
Imports<br />
2012-13 to 5 year<br />
2011-12 2012-13 <strong>2013</strong>-<strong>14</strong> <strong>2013</strong>-<strong>14</strong> trend<br />
Total goods & services imports 318,912 321,118 3<strong>14</strong>,387 -2.1 6.0<br />
Goods imports 255,836 253,537 250,135 -1.3 5.6<br />
General merchandise 249,319 248,368 245,499 -1.2 6.5<br />
Consumption goods 72,085 75,058 76,827 2.4 6.5<br />
Capital goods 69,187 65,000 60,280 -7.3 10.9<br />
Intermediate & other goods 108,074 108,311 108,392 0.1 4.0<br />
Non-monetary gold 6,477 5,168 4,635 -10.3 -19.0<br />
Services imports 62,961 67,581 64,252 -4.9 7.3<br />
Manufacturing services on physical inputs<br />
owned by others 0 0 0 .. ..<br />
Maintenance & repair services nie 386 607 701 15.5 34.1<br />
Transport 15,993 16,857 16,168 -4.1 4.5<br />
Travel 27,3<strong>14</strong> 28,025 26,935 -3.9 7.4<br />
Other 19,268 22,091 20,449 -7.4 9.1<br />
(a) Balance of payments basis. (b) Reference year for chain volume measures is 2012-13.<br />
Based on ABS catalogue 5302.0.<br />
% growth<br />
% growth