

cot-fy-2013-14
cot-fy-2013-14
cot-fy-2013-14

Create successful ePaper yourself
Turn your PDF publications into a flip-book with our unique Google optimized e-Paper software.
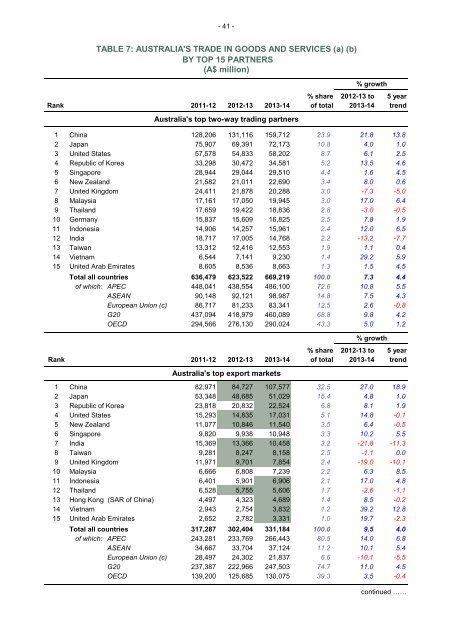
- 41 -<br />
TABLE 7: AUSTRALIA'S TRADE IN GOODS AND SERVICES (a) (b)<br />
BY TOP 15 PARTNERS<br />
(A$ million)<br />
% share 2012-13 to 5 year<br />
Rank 2011-12 2012-13 <strong>2013</strong>-<strong>14</strong> of total <strong>2013</strong>-<strong>14</strong> trend<br />
Australia's top two-way trading partners<br />
1 China 128,206 131,116 159,712 23.9 21.8 13.8<br />
2 Japan 75,907 69,391 72,173 10.8 4.0 1.0<br />
3 United States 57,578 54,833 58,202 8.7 6.1 2.5<br />
4 Republic of Korea 33,298 30,472 34,581 5.2 13.5 4.6<br />
5 Singapore 28,944 29,044 29,510 4.4 1.6 4.5<br />
6 New Zealand 21,582 21,011 22,690 3.4 8.0 0.6<br />
7 United Kingdom 24,411 21,878 20,288 3.0 -7.3 -5.0<br />
8 Malaysia 17,161 17,050 19,945 3.0 17.0 6.4<br />
9 Thailand 17,659 19,422 18,836 2.8 -3.0 -0.5<br />
10 Germany 15,837 15,609 16,825 2.5 7.8 1.9<br />
11 Indonesia <strong>14</strong>,906 <strong>14</strong>,257 15,961 2.4 12.0 6.5<br />
12 India 18,717 17,005 <strong>14</strong>,768 2.2 -13.2 -7.7<br />
13 Taiwan 13,312 12,416 12,553 1.9 1.1 0.4<br />
<strong>14</strong> Vietnam 6,544 7,<strong>14</strong>1 9,230 1.4 29.2 5.9<br />
15 United Arab Emirates 8,605 8,536 8,663 1.3 1.5 4.5<br />
Total all countries 636,479 623,522 669,219 100.0 7.3 4.4<br />
of which: APEC 448,041 438,554 486,100 72.6 10.8 5.5<br />
ASEAN 90,<strong>14</strong>8 92,121 98,987 <strong>14</strong>.8 7.5 4.3<br />
European Union (c) 86,717 81,233 83,341 12.5 2.6 -0.8<br />
G20 437,094 418,979 460,089 68.8 9.8 4.2<br />
OECD 294,566 276,130 290,024 43.3 5.0 1.2<br />
% share 2012-13 to 5 year<br />
Rank 2011-12 2012-13 <strong>2013</strong>-<strong>14</strong> of total <strong>2013</strong>-<strong>14</strong> trend<br />
Australia's top export markets<br />
% growth<br />
% growth<br />
1 China 82,971 84,727 107,577 32.5 27.0 18.9<br />
2 Japan 53,348 48,685 51,029 15.4 4.8 1.0<br />
3 Republic of Korea 23,818 20,832 22,524 6.8 8.1 1.9<br />
4 United States 15,293 <strong>14</strong>,835 17,031 5.1 <strong>14</strong>.8 -0.1<br />
5 New Zealand 11,077 10,846 11,540 3.5 6.4 -0.5<br />
6 Singapore 9,820 9,938 10,948 3.3 10.2 5.5<br />
7 India 15,369 13,366 10,458 3.2 -21.8 -11.3<br />
8 Taiwan 9,281 8,247 8,158 2.5 -1.1 0.0<br />
9 United Kingdom 11,971 9,701 7,854 2.4 -19.0 -10.1<br />
10 Malaysia 6,666 6,808 7,239 2.2 6.3 8.5<br />
11 Indonesia 6,401 5,901 6,906 2.1 17.0 4.8<br />
12 Thailand 6,528 5,755 5,606 1.7 -2.6 -1.1<br />
13 Hong Kong (SAR of China) 4,497 4,323 4,689 1.4 8.5 -0.2<br />
<strong>14</strong> Vietnam 2,943 2,754 3,832 1.2 39.2 12.8<br />
15 United Arab Emirates 2,652 2,782 3,331 1.0 19.7 -2.3<br />
Total all countries 317,287 302,404 331,184 100.0 9.5 4.0<br />
of which: APEC 243,281 233,769 266,443 80.5 <strong>14</strong>.0 6.8<br />
ASEAN 34,667 33,704 37,124 11.2 10.1 5.4<br />
European Union (c) 28,497 24,302 21,837 6.6 -10.1 -5.5<br />
G20 237,387 222,966 247,503 74.7 11.0 4.5<br />
OECD 139,200 125,685 130,075 39.3 3.5 -0.4<br />
continued ……