

cot-fy-2013-14
cot-fy-2013-14
cot-fy-2013-14

You also want an ePaper? Increase the reach of your titles
YUMPU automatically turns print PDFs into web optimized ePapers that Google loves.
- 94 -<br />
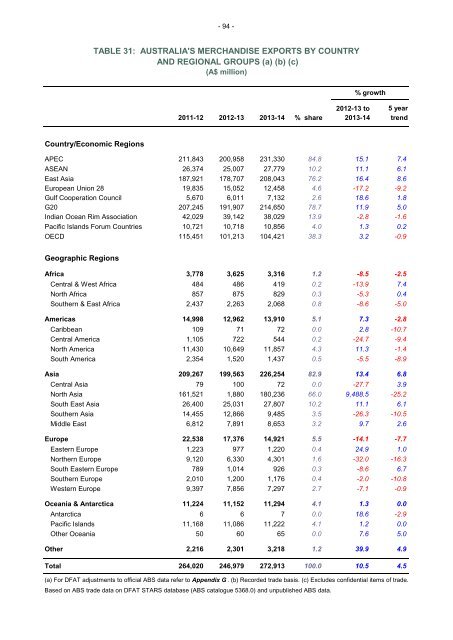
TABLE 31: AUSTRALIA'S MERCHANDISE EXPORTS BY COUNTRY<br />
AND REGIONAL GROUPS (a) (b) (c)<br />
(A$ million)<br />
% growth<br />
2012-13 to 5 year<br />
2011-12 2012-13 <strong>2013</strong>-<strong>14</strong> % share <strong>2013</strong>-<strong>14</strong> trend<br />
Country/Economic Regions<br />
APEC 211,843 200,958 231,330 84.8 15.1 7.4<br />
ASEAN 26,374 25,007 27,779 10.2 11.1 6.1<br />
East Asia 187,921 178,707 208,043 76.2 16.4 8.6<br />
European Union 28 19,835 15,052 12,458 4.6 -17.2 -9.2<br />
Gulf Cooperation Council 5,670 6,011 7,132 2.6 18.6 1.8<br />
G20 207,245 191,907 2<strong>14</strong>,650 78.7 11.9 5.0<br />
Indian Ocean Rim Association 42,029 39,<strong>14</strong>2 38,029 13.9 -2.8 -1.6<br />
Pacific Islands Forum Countries 10,721 10,718 10,856 4.0 1.3 0.2<br />
OECD 115,451 101,213 104,421 38.3 3.2 -0.9<br />
Geographic Regions<br />
Africa 3,778 3,625 3,316 1.2 -8.5 -2.5<br />
Central & West Africa 484 486 419 0.2 -13.9 7.4<br />
North Africa 857 875 829 0.3 -5.3 0.4<br />
Southern & East Africa 2,437 2,263 2,068 0.8 -8.6 -5.0<br />
Americas <strong>14</strong>,998 12,962 13,910 5.1 7.3 -2.8<br />
Caribbean 109 71 72 0.0 2.8 -10.7<br />
Central America 1,105 722 544 0.2 -24.7 -9.4<br />
North America 11,430 10,649 11,857 4.3 11.3 -1.4<br />
South America 2,354 1,520 1,437 0.5 -5.5 -8.9<br />
Asia 209,267 199,563 226,254 82.9 13.4 6.8<br />
Central Asia 79 100 72 0.0 -27.7 3.9<br />
North Asia 161,521 1,880 180,236 66.0 9,488.5 -25.2<br />
South East Asia 26,400 25,031 27,807 10.2 11.1 6.1<br />
Southern Asia <strong>14</strong>,455 12,866 9,485 3.5 -26.3 -10.5<br />
Middle East 6,812 7,891 8,653 3.2 9.7 2.6<br />
Europe 22,538 17,376 <strong>14</strong>,921 5.5 -<strong>14</strong>.1 -7.7<br />
Eastern Europe 1,223 977 1,220 0.4 24.9 1.0<br />
Northern Europe 9,120 6,330 4,301 1.6 -32.0 -16.3<br />
South Eastern Europe 789 1,0<strong>14</strong> 926 0.3 -8.6 6.7<br />
Southern Europe 2,010 1,200 1,176 0.4 -2.0 -10.8<br />
Western Europe 9,397 7,856 7,297 2.7 -7.1 -0.9<br />
Oceania & Antarctica 11,224 11,152 11,294 4.1 1.3 0.0<br />
Antarctica 6 6 7 0.0 18.6 -2.9<br />
Pacific Islands 11,168 11,086 11,222 4.1 1.2 0.0<br />
Other Oceania 50 60 65 0.0 7.6 5.0<br />
Other 2,216 2,301 3,218 1.2 39.9 4.9<br />
Total 264,020 246,979 272,913 100.0 10.5 4.5<br />
(a) For DFAT adjustments to official ABS data refer to Appendix G . (b) Recorded trade basis. (c) Excludes confidential items of trade.<br />
Based on ABS trade data on DFAT STARS database (ABS catalogue 5368.0) and unpublished ABS data.