

cot-fy-2013-14
cot-fy-2013-14
cot-fy-2013-14

Create successful ePaper yourself
Turn your PDF publications into a flip-book with our unique Google optimized e-Paper software.
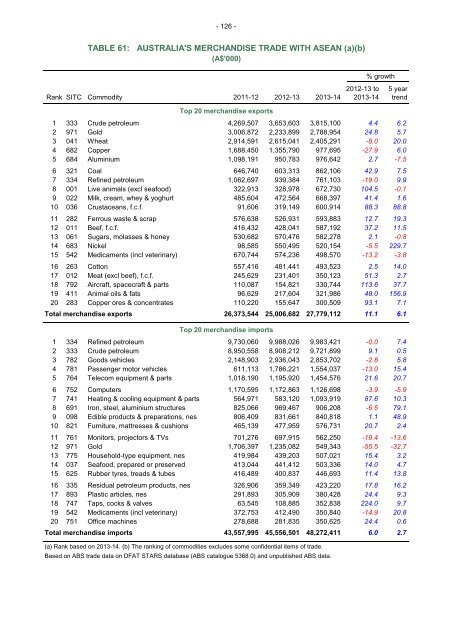
- 126 -<br />
TABLE 61: AUSTRALIA'S MERCHANDISE TRADE WITH ASEAN (a)(b)<br />
(A$'000)<br />
% growth<br />
2012-13 to 5 year<br />
Rank SITC Commodity 2011-12 2012-13 <strong>2013</strong>-<strong>14</strong> <strong>2013</strong>-<strong>14</strong> trend<br />
Top 20 merchandise exports<br />
1 333 Crude petroleum 4,269,507 3,653,603 3,815,100 4.4 6.2<br />
2 971 Gold 3,006,872 2,233,899 2,788,954 24.8 5.7<br />
3 041 Wheat 2,9<strong>14</strong>,591 2,615,041 2,405,291 -8.0 20.0<br />
4 682 Copper 1,688,450 1,355,790 977,695 -27.9 6.0<br />
5 684 Aluminium 1,098,191 950,783 976,642 2.7 -7.5<br />
6 321 Coal 646,740 603,313 862,106 42.9 7.5<br />
7 334 Refined petroleum 1,062,697 939,384 761,103 -19.0 9.9<br />
8 001 Live animals (excl seafood) 322,913 328,978 672,730 104.5 -0.1<br />
9 022 Milk, cream, whey & yoghurt 485,604 472,564 668,397 41.4 1.6<br />
10 036 Crustaceans, f.c.f. 91,606 319,<strong>14</strong>9 600,9<strong>14</strong> 88.3 88.8<br />
11 282 Ferrous waste & scrap 576,638 526,931 593,883 12.7 19.3<br />
12 011 Beef, f.c.f. 416,432 428,041 587,192 37.2 11.5<br />
13 061 Sugars, molasses & honey 530,682 570,476 582,278 2.1 -0.8<br />
<strong>14</strong> 683 Nickel 98,585 550,495 520,154 -5.5 229.7<br />
15 542 Medicaments (incl veterinary) 670,744 574,236 498,570 -13.2 -3.8<br />
16 263 Cotton 557,416 481,441 493,523 2.5 <strong>14</strong>.0<br />
17 012 Meat (excl beef), f.c.f. 245,629 231,401 350,123 51.3 2.7<br />
18 792 Aircraft, spacecraft & parts 110,087 154,821 330,744 113.6 37.7<br />
19 411 Animal oils & fats 96,629 217,604 321,986 48.0 156.9<br />
20 283 Copper ores & concentrates 110,220 155,647 300,509 93.1 7.1<br />
Total merchandise exports 26,373,544 25,006,682 27,779,112 11.1 6.1<br />
Top 20 merchandise imports<br />
1 334 Refined petroleum 9,730,060 9,988,026 9,983,421 -0.0 7.4<br />
2 333 Crude petroleum 8,950,558 8,908,212 9,721,899 9.1 0.5<br />
3 782 Goods vehicles 2,<strong>14</strong>8,903 2,936,043 2,853,702 -2.8 5.8<br />
4 781 Passenger motor vehicles 611,113 1,786,221 1,554,037 -13.0 15.4<br />
5 764 Telecom equipment & parts 1,018,190 1,195,920 1,454,576 21.6 20.7<br />
6 752 Computers 1,170,595 1,172,863 1,126,698 -3.9 -5.9<br />
7 741 Heating & cooling equipment & parts 564,971 583,120 1,093,919 87.6 10.3<br />
8 691 Iron, steel, aluminium structures 825,066 969,467 906,208 -6.5 79.1<br />
9 098 Edible products & preparations, nes 806,409 831,661 840,818 1.1 48.9<br />
10 821 Furniture, mattresses & cushions 465,139 477,959 576,731 20.7 2.4<br />
11 761 Monitors, projectors & TVs 701,276 697,915 562,250 -19.4 -13.6<br />
12 971 Gold 1,706,397 1,235,082 549,343 -55.5 -32.7<br />
13 775 Household-type equipment, nes 419,984 439,203 507,021 15.4 3.2<br />
<strong>14</strong> 037 Seafood, prepared or preserved 413,044 441,412 503,336 <strong>14</strong>.0 4.7<br />
15 625 Rubber tyres, treads & tubes 416,489 400,837 446,693 11.4 13.8<br />
16 335 Residual petroleum products, nes 326,906 359,349 423,220 17.8 16.2<br />
17 893 Plastic articles, nes 291,893 305,909 380,428 24.4 9.3<br />
18 747 Taps, cocks & valves 63,545 108,885 352,838 224.0 9.7<br />
19 542 Medicaments (incl veterinary) 372,753 412,490 350,840 -<strong>14</strong>.9 20.8<br />
20 751 Office machines 278,688 281,835 350,625 24.4 0.6<br />
Total merchandise imports 43,557,995 45,556,501 48,272,411 6.0 2.7<br />
(a) Rank based on <strong>2013</strong>-<strong>14</strong>. (b) The ranking of commodities excludes some confidential items of trade.<br />
Based on ABS trade data on DFAT STARS database (ABS catalogue 5368.0) and unpublished ABS data.