

cot-fy-2013-14
cot-fy-2013-14
cot-fy-2013-14

You also want an ePaper? Increase the reach of your titles
YUMPU automatically turns print PDFs into web optimized ePapers that Google loves.
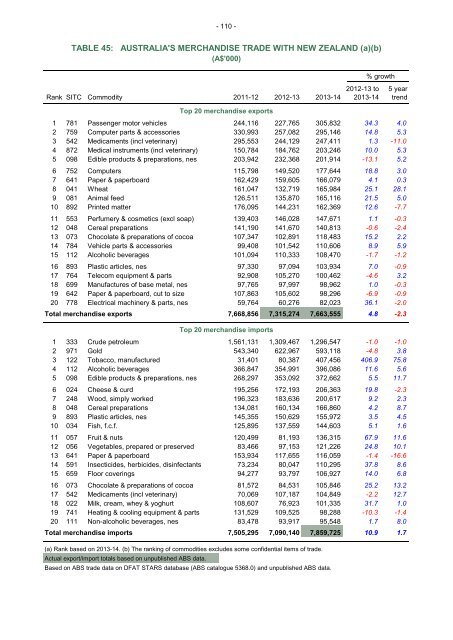
- 110 -<br />
TABLE 45: AUSTRALIA'S MERCHANDISE TRADE WITH NEW ZEALAND (a)(b)<br />
(A$'000)<br />
% growth<br />
2012-13 to 5 year<br />
Rank SITC Commodity 2011-12 2012-13 <strong>2013</strong>-<strong>14</strong> <strong>2013</strong>-<strong>14</strong> trend<br />
Top 20 merchandise exports<br />
1 781 Passenger motor vehicles 244,116 227,765 305,832 34.3 4.0<br />
2 759 Computer parts & accessories 330,993 257,082 295,<strong>14</strong>6 <strong>14</strong>.8 5.3<br />
3 542 Medicaments (incl veterinary) 295,553 244,129 247,411 1.3 -11.0<br />
4 872 Medical instruments (incl veterinary) 150,784 184,762 203,246 10.0 5.3<br />
5 098 Edible products & preparations, nes 203,942 232,368 201,9<strong>14</strong> -13.1 5.2<br />
6 752 Computers 115,798 <strong>14</strong>9,520 177,644 18.8 3.0<br />
7 641 Paper & paperboard 162,429 159,605 166,079 4.1 0.3<br />
8 041 Wheat 161,047 132,719 165,984 25.1 28.1<br />
9 081 Animal feed 126,511 135,870 165,116 21.5 5.0<br />
10 892 Printed matter 176,095 <strong>14</strong>4,231 162,369 12.6 -7.7<br />
11 553 Perfumery & cosmetics (excl soap) 139,403 <strong>14</strong>6,028 <strong>14</strong>7,671 1.1 -0.3<br />
12 048 Cereal preparations <strong>14</strong>1,190 <strong>14</strong>1,670 <strong>14</strong>0,813 -0.6 -2.4<br />
13 073 Chocolate & preparations of cocoa 107,347 102,891 118,483 15.2 2.2<br />
<strong>14</strong> 784 Vehicle parts & accessories 99,408 101,542 110,606 8.9 5.9<br />
15 112 Alcoholic beverages 101,094 110,333 108,470 -1.7 -1.2<br />
16 893 Plastic articles, nes 97,330 97,094 103,934 7.0 -0.9<br />
17 764 Telecom equipment & parts 92,908 105,270 100,462 -4.6 3.2<br />
18 699 Manufactures of base metal, nes 97,765 97,997 98,962 1.0 -0.3<br />
19 642 Paper & paperboard, cut to size 107,863 105,602 98,296 -6.9 -0.9<br />
20 778 Electrical machinery & parts, nes 59,764 60,276 82,023 36.1 -2.0<br />
Total merchandise exports 7,668,856 7,315,274 7,663,555 4.8 -2.3<br />
Top 20 merchandise imports<br />
1 333 Crude petroleum 1,561,131 1,309,467 1,296,547 -1.0 -1.0<br />
2 971 Gold 543,340 622,967 593,118 -4.8 3.8<br />
3 122 Tobacco, manufactured 31,401 80,387 407,456 406.9 75.8<br />
4 112 Alcoholic beverages 366,847 354,991 396,086 11.6 5.6<br />
5 098 Edible products & preparations, nes 268,297 353,092 372,662 5.5 11.7<br />
6 024 Cheese & curd 195,256 172,193 206,363 19.8 -2.3<br />
7 248 Wood, simply worked 196,323 183,636 200,617 9.2 2.3<br />
8 048 Cereal preparations 134,081 160,134 166,860 4.2 8.7<br />
9 893 Plastic articles, nes <strong>14</strong>5,355 150,629 155,972 3.5 4.5<br />
10 034 Fish, f.c.f. 125,895 137,559 <strong>14</strong>4,603 5.1 1.6<br />
11 057 Fruit & nuts 120,499 81,193 136,315 67.9 11.6<br />
12 056 Vegetables, prepared or preserved 83,466 97,153 121,226 24.8 10.1<br />
13 641 Paper & paperboard 153,934 117,655 116,059 -1.4 -16.6<br />
<strong>14</strong> 591 Insecticides, herbicides, disinfectants 73,234 80,047 110,295 37.8 8.6<br />
15 659 Floor coverings 94,277 93,797 106,927 <strong>14</strong>.0 6.8<br />
16 073 Chocolate & preparations of cocoa 81,572 84,531 105,846 25.2 13.2<br />
17 542 Medicaments (incl veterinary) 70,069 107,187 104,849 -2.2 12.7<br />
18 022 Milk, cream, whey & yoghurt 108,607 76,923 101,335 31.7 1.0<br />
19 741 Heating & cooling equipment & parts 131,529 109,525 98,288 -10.3 -1.4<br />
20 111 Non-alcoholic beverages, nes 83,478 93,917 95,548 1.7 8.0<br />
Total merchandise imports 7,505,295 7,090,<strong>14</strong>0 7,859,725 10.9 1.7<br />
(a) Rank based on <strong>2013</strong>-<strong>14</strong>. (b) The ranking of commodities excludes some confidential items of trade.<br />
Actual export/import totals based on unpublished ABS data.<br />
Based on ABS trade data on DFAT STARS database (ABS catalogue 5368.0) and unpublished ABS data.