

cot-fy-2013-14
cot-fy-2013-14
cot-fy-2013-14

Create successful ePaper yourself
Turn your PDF publications into a flip-book with our unique Google optimized e-Paper software.
- <strong>14</strong> -<br />
Australia’s direction of trade 6<br />
• China was Australia’s largest individual two-way goods and services trading partner in <strong>2013</strong>-<strong>14</strong>, accounting<br />
for 23.9 per cent ($159.7 billion) of total trade. Japan was the second largest trading partner accounting for<br />
10.8 per cent ($72.2 billion) followed by the United States, accounting for 8.7 per cent ($58.2 billion).<br />
• APEC members accounted for 72.6 per cent of Australia’s total trade while the members of the European<br />
Union accounted for 12.5 per cent.<br />
• In <strong>2013</strong>-<strong>14</strong> exports to: APEC members increased <strong>14</strong>.0 per cent; ASEAN members rose 10.1 per cent;<br />
members of the European Union decreased 10.1 per cent; G20 members rose 11.0 per cent and OECD<br />
countries increased 3.5 per cent.<br />
• Imports from: APEC members increased 7.3 per cent; ASEAN members increased 5.9 per cent; members of<br />
the European Union increased 8.0 per cent; G20 members rose 8.5 per cent and OECD countries increased<br />
6.3 per cent.<br />
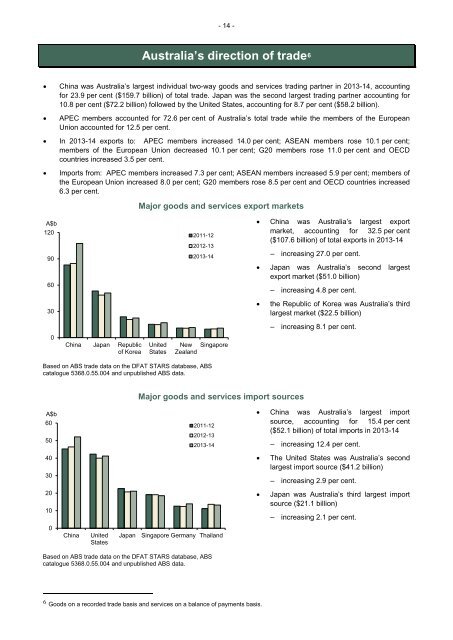
Major goods and services export markets<br />
A$b<br />
120<br />
90<br />
60<br />
30<br />
2011-12<br />
2012-13<br />
<strong>2013</strong>-<strong>14</strong><br />
• China was Australia’s largest export<br />
market, accounting for 32.5 per cent<br />
($107.6 billion) of total exports in <strong>2013</strong>-<strong>14</strong><br />
– increasing 27.0 per cent.<br />
• Japan was Australia’s second largest<br />
export market ($51.0 billion)<br />
– increasing 4.8 per cent.<br />
• the Republic of Korea was Australia’s third<br />
largest market ($22.5 billion)<br />
– increasing 8.1 per cent.<br />
0<br />
China Japan Republic<br />
of Korea<br />
United<br />
States<br />
New Singapore<br />
Zealand<br />
Based on ABS trade data on the DFAT STARS database, ABS<br />
catalogue 5368.0.55.004 and unpublished ABS data.<br />
Major goods and services import sources<br />
A$b<br />
60<br />
50<br />
2011-12<br />
2012-13<br />
<strong>2013</strong>-<strong>14</strong><br />
• China was Australia’s largest import<br />
source, accounting for 15.4 per cent<br />
($52.1 billion) of total imports in <strong>2013</strong>-<strong>14</strong><br />
– increasing 12.4 per cent.<br />
40<br />
30<br />
• The United States was Australia’s second<br />
largest import source ($41.2 billion)<br />
– increasing 2.9 per cent.<br />
20<br />
10<br />
• Japan was Australia’s third largest import<br />
source ($21.1 billion)<br />
– increasing 2.1 per cent.<br />
0<br />
China<br />
United<br />
States<br />
Japan<br />
Singapore Germany Thailand<br />
Based on ABS trade data on the DFAT STARS database, ABS<br />
catalogue 5368.0.55.004 and unpublished ABS data.<br />
6 Goods on a recorded trade basis and services on a balance of payments basis.