

cot-fy-2013-14
cot-fy-2013-14
cot-fy-2013-14

Create successful ePaper yourself
Turn your PDF publications into a flip-book with our unique Google optimized e-Paper software.
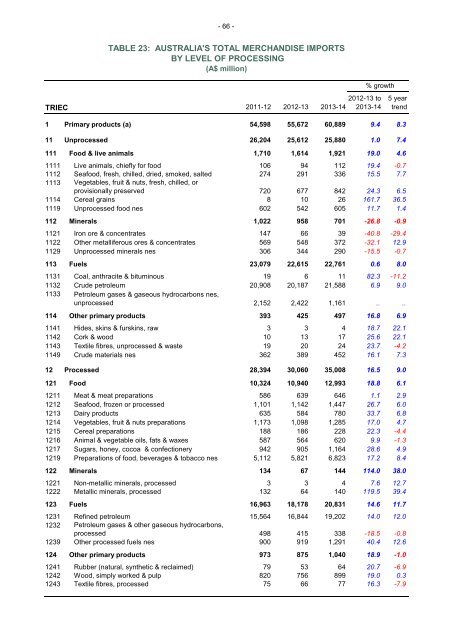
- 66 -<br />
TABLE 23: AUSTRALIA'S TOTAL MERCHANDISE IMPORTS<br />
BY LEVEL OF PROCESSING<br />
(A$ million)<br />
% growth<br />
2012-13 to 5 year<br />
TRIEC 2011-12 2012-13 <strong>2013</strong>-<strong>14</strong> <strong>2013</strong>-<strong>14</strong> trend<br />
1 Primary products (a) 54,598 55,672 60,889 9.4 8.3<br />
11 Unprocessed 26,204 25,612 25,880 1.0 7.4<br />
111 Food & live animals 1,710 1,6<strong>14</strong> 1,921 19.0 4.6<br />
1111 Live animals, chiefly for food 106 94 112 19.4 -0.7<br />
1112 Seafood, fresh, chilled, dried, smoked, salted 274 291 336 15.5 7.7<br />
1113 Vegetables, fruit & nuts, fresh, chilled, or<br />
provisionally preserved 720 677 842 24.3 6.5<br />
11<strong>14</strong> Cereal grains 8 10 26 161.7 36.5<br />
1119 Unprocessed food nes 602 542 605 11.7 1.4<br />
112 Minerals 1,022 958 701 -26.8 -0.9<br />
1121 Iron ore & concentrates <strong>14</strong>7 66 39 -40.8 -29.4<br />
1122 Other metalliferous ores & concentrates 569 548 372 -32.1 12.9<br />
1129 Unprocessed minerals nes 306 344 290 -15.5 -0.7<br />
113 Fuels 23,079 22,615 22,761 0.6 8.0<br />
1131 Coal, anthracite & bituminous 19 6 11 82.3 -11.2<br />
1132 Crude petroleum 20,908 20,187 21,588 6.9 9.0<br />
1133 Petroleum gases & gaseous hydrocarbons nes,<br />
unprocessed 2,152 2,422 1,161 .. ..<br />
1<strong>14</strong> Other primary products 393 425 497 16.8 6.9<br />
1<strong>14</strong>1 Hides, skins & furskins, raw 3 3 4 18.7 22.1<br />
1<strong>14</strong>2 Cork & wood 10 13 17 25.6 22.1<br />
1<strong>14</strong>3 Textile fibres, unprocessed & waste 19 20 24 23.7 -4.2<br />
1<strong>14</strong>9 Crude materials nes 362 389 452 16.1 7.3<br />
12 Processed 28,394 30,060 35,008 16.5 9.0<br />
121 Food 10,324 10,940 12,993 18.8 6.1<br />
1211 Meat & meat preparations 586 639 646 1.1 2.9<br />
1212 Seafood, frozen or processed 1,101 1,<strong>14</strong>2 1,447 26.7 6.0<br />
1213 Dairy products 635 584 780 33.7 6.8<br />
12<strong>14</strong> Vegetables, fruit & nuts preparations 1,173 1,098 1,285 17.0 4.7<br />
1215 Cereal preparations 188 186 228 22.3 -4.4<br />
1216 Animal & vegetable oils, fats & waxes 587 564 620 9.9 -1.3<br />
1217 Sugars, honey, cocoa & confectionery 942 905 1,164 28.6 4.9<br />
1219 Preparations of food, beverages & tobacco nes 5,112 5,821 6,823 17.2 8.4<br />
122 Minerals 134 67 <strong>14</strong>4 1<strong>14</strong>.0 38.0<br />
1221 Non-metallic minerals, processed 3 3 4 7.6 12.7<br />
1222 Metallic minerals, processed 132 64 <strong>14</strong>0 119.5 39.4<br />
123 Fuels 16,963 18,178 20,831 <strong>14</strong>.6 11.7<br />
1231 Refined petroleum 15,564 16,844 19,202 <strong>14</strong>.0 12.0<br />
1232 Petroleum gases & other gaseous hydrocarbons,<br />
processed 498 415 338 -18.5 -0.8<br />
1239 Other processed fuels nes 900 919 1,291 40.4 12.6<br />
124 Other primary products 973 875 1,040 18.9 -1.0<br />
1241 Rubber (natural, synthetic & reclaimed) 79 53 64 20.7 -6.9<br />
1242 Wood, simply worked & pulp 820 756 899 19.0 0.3<br />
1243 Textile fibres, processed 75 66 77 16.3 -7.9