

cot-fy-2013-14
cot-fy-2013-14
cot-fy-2013-14

Create successful ePaper yourself
Turn your PDF publications into a flip-book with our unique Google optimized e-Paper software.
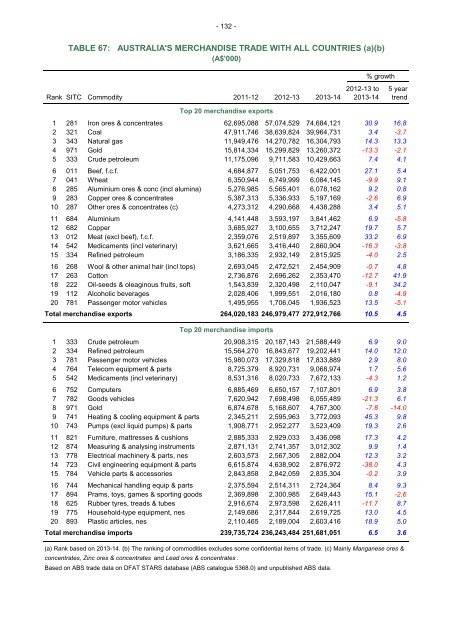
- 132 -<br />
TABLE 67: AUSTRALIA'S MERCHANDISE TRADE WITH ALL COUNTRIES (a)(b)<br />
(A$'000)<br />
% growth<br />
2012-13 to 5 year<br />
Rank SITC Commodity 2011-12 2012-13 <strong>2013</strong>-<strong>14</strong> <strong>2013</strong>-<strong>14</strong> trend<br />
Top 20 merchandise exports<br />
1 281 Iron ores & concentrates 62,695,088 57,074,529 74,684,121 30.9 16.8<br />
2 321 Coal 47,911,746 38,639,824 39,964,731 3.4 -3.7<br />
3 343 Natural gas 11,949,476 <strong>14</strong>,270,782 16,304,793 <strong>14</strong>.3 13.3<br />
4 971 Gold 15,8<strong>14</strong>,334 15,299,829 13,260,372 -13.3 -2.1<br />
5 333 Crude petroleum 11,175,096 9,711,583 10,429,663 7.4 4.1<br />
6 011 Beef, f.c.f. 4,684,877 5,051,753 6,422,001 27.1 5.4<br />
7 041 Wheat 6,350,944 6,749,999 6,084,<strong>14</strong>5 -9.9 9.1<br />
8 285 Aluminium ores & conc (incl alumina) 5,276,985 5,565,401 6,078,162 9.2 0.8<br />
9 283 Copper ores & concentrates 5,387,313 5,336,933 5,197,169 -2.6 6.9<br />
10 287 Other ores & concentrates (c) 4,273,312 4,290,668 4,438,288 3.4 5.1<br />
11 684 Aluminium 4,<strong>14</strong>1,448 3,593,197 3,841,462 6.9 -5.8<br />
12 682 Copper 3,685,927 3,100,655 3,712,247 19.7 5.7<br />
13 012 Meat (excl beef), f.c.f. 2,359,076 2,519,897 3,355,609 33.2 6.9<br />
<strong>14</strong> 542 Medicaments (incl veterinary) 3,621,665 3,416,440 2,860,904 -16.3 -3.8<br />
15 334 Refined petroleum 3,186,335 2,932,<strong>14</strong>9 2,815,925 -4.0 2.5<br />
16 268 Wool & other animal hair (incl tops) 2,693,045 2,472,521 2,454,909 -0.7 4.8<br />
17 263 Cotton 2,736,876 2,696,262 2,353,470 -12.7 41.9<br />
18 222 Oil-seeds & oleaginous fruits, soft 1,543,839 2,320,498 2,110,047 -9.1 34.2<br />
19 112 Alcoholic beverages 2,028,406 1,999,551 2,016,180 0.8 -4.9<br />
20 781 Passenger motor vehicles 1,495,955 1,706,045 1,936,523 13.5 -5.1<br />
Total merchandise exports 264,020,183 246,979,477 272,912,766 10.5 4.5<br />
Top 20 merchandise imports<br />
1 333 Crude petroleum 20,908,315 20,187,<strong>14</strong>3 21,588,449 6.9 9.0<br />
2 334 Refined petroleum 15,564,270 16,843,677 19,202,441 <strong>14</strong>.0 12.0<br />
3 781 Passenger motor vehicles 15,980,073 17,329,818 17,833,889 2.9 8.0<br />
4 764 Telecom equipment & parts 8,725,379 8,920,731 9,068,974 1.7 5.6<br />
5 542 Medicaments (incl veterinary) 8,531,316 8,020,733 7,672,133 -4.3 1.2<br />
6 752 Computers 6,885,469 6,650,157 7,107,801 6.9 3.8<br />
7 782 Goods vehicles 7,620,942 7,698,498 6,055,489 -21.3 6.1<br />
8 971 Gold 6,874,678 5,168,607 4,767,300 -7.8 -<strong>14</strong>.0<br />
9 741 Heating & cooling equipment & parts 2,345,211 2,595,963 3,772,093 45.3 9.8<br />
10 743 Pumps (excl liquid pumps) & parts 1,908,771 2,952,277 3,523,409 19.3 2.6<br />
11 821 Furniture, mattresses & cushions 2,885,333 2,929,033 3,436,098 17.3 4.2<br />
12 874 Measuring & analysing instruments 2,871,131 2,741,357 3,012,302 9.9 1.4<br />
13 778 Electrical machinery & parts, nes 2,603,573 2,567,305 2,882,004 12.3 3.2<br />
<strong>14</strong> 723 Civil engineering equipment & parts 6,615,874 4,638,902 2,876,972 -38.0 4.3<br />
15 784 Vehicle parts & accessories 2,843,858 2,842,059 2,835,304 -0.2 3.9<br />
16 744 Mechanical handling equip & parts 2,375,594 2,5<strong>14</strong>,311 2,724,364 8.4 9.3<br />
17 894 Prams, toys, games & sporting goods 2,369,898 2,300,985 2,649,443 15.1 -2.6<br />
18 625 Rubber tyres, treads & tubes 2,916,674 2,973,598 2,626,411 -11.7 8.7<br />
19 775 Household-type equipment, nes 2,<strong>14</strong>9,686 2,317,844 2,619,725 13.0 4.5<br />
20 893 Plastic articles, nes 2,110,465 2,189,004 2,603,416 18.9 5.0<br />
Total merchandise imports 239,735,724 236,243,484 251,681,051 6.5 3.6<br />
(a) Rank based on <strong>2013</strong>-<strong>14</strong>. (b) The ranking of commodities excludes some confidential items of trade. (c) Mainly Manganese ores &<br />
concentrates, Zinc ores & concentrates and Lead ores & concentrates .<br />
Based on ABS trade data on DFAT STARS database (ABS catalogue 5368.0) and unpublished ABS data.